Substitutions during an NFL game often look like a line change in a hockey game in between each play. The offensive team puts their 11 players on the field and the defense often substitutes based on who they see on offense or who enters the game – otherwise known as the personnel group.
During our Teaching Month here at PFF, we have looked at the glossary of PFF Signature Stats and how teams implement man versus zone coverage on defense among other feature stories.
Today, we examine the offensive personnel groupings like never before – what defines each, the trends over time across the entire league and how the various teams used these groupings in 2017.
Of the 11 offensive players on the field, five offensive linemen and the quarterback typically take up six spots, leaving five additional spots for some combination of running backs, tight ends and wide receivers. The personnel grouping is a two-digit number, the number of running backs signifies the first digit and the number of tight ends is the second digit. The remaining is the number of wide receivers that give you a total of five additional players after the offensive line and quarterback.
Thus, when you hear the term “11” personnel, there is one running back, one tight end and three wide receivers on the field. The chart below breaks down the distribution of the seven-most common NFL personnel groupings.
| Personnel Group | Running Backs | Tight Ends | Wide Receivers |
| 10 | 1 | 0 | 4 |
| 11 | 1 | 1 | 3 |
| 12 | 1 | 2 | 2 |
| 13 | 1 | 3 | 1 |
| 20 | 2 | 0 | 3 |
| 21 | 2 | 1 | 2 |
| 22 | 2 | 2 | 1 |
*Of note, this is specific to the players on the field and not factoring in the next level of detail – the formation*
Back in 2015, we ranked the top WR groups at the time based on our grades. Also included was data citing the league’s evolution into receiver-dominated personnel groupings, with over 56 percent of plays at the time including 3-WR sets (11 personnel) and only four teams using a 2-WR set more than a 3-WR set. Just how much has that changed over the past two seasons? What about even further back to the 2008 season? Below are the four most popular personnel groupings and their average distribution factoring in all teams and plays for that season.
Personnel grouping averages for NFL teams since 2008
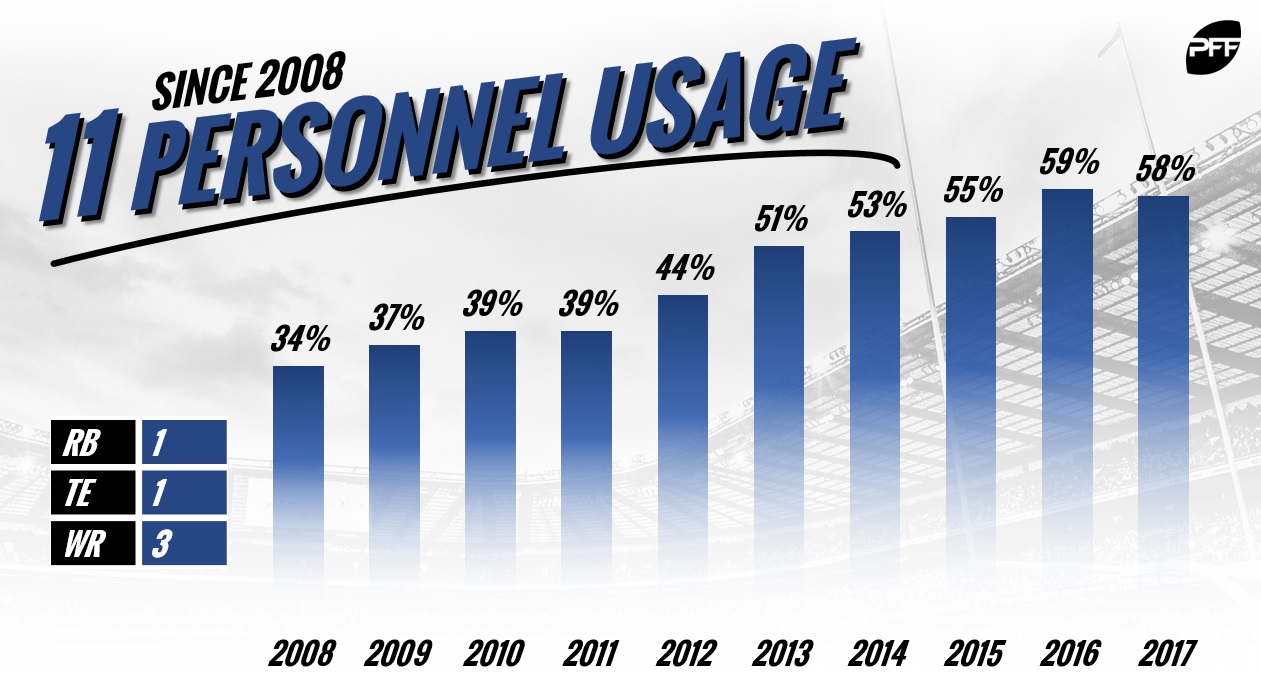
Though we all probably knew this in the back of our minds, seeing the data over a long period of time quantifies just how much the league has flipped from a personnel standpoint.
Overall, a trend that started even earlier than our data shows, is now clearly defined – the NFL is an 11 personnel league.
|
Year |
11
Personnel |
12
Personnel |
21
Personnel |
22
Personnel |
| 2008 | 34 % | 20 % | 23 % | 10 % |
| 2009 | 37 % | 21 % | 21 % | 11 % |
| 2010 | 39 % | 21 % | 19 % | 9 % |
| 2011 | 39 % | 21 % | 17 % | 8 % |
| 2012 | 44 % | 20 % | 17 % | 6 % |
| 2013 | 51 % | 19 % | 13 % | 5 % |
| 2014 | 53 % | 20 % | 11 % | 5 % |
| 2015 | 55 % | 21 % | 8 % | 4 % |
| 2016 | 59 % | 17 % | 7 % | 3 % |
| 2017 | 58 % | 19 % | 8 % | 4 % |
Two running back sets that used to make up over 30 percent of league personnel usage in 2008, now barely made up 12 percent of offensive personnel packages in 2017. In fact, every single NFL team used 11 personnel as their primary personnel group in 2017. Moreover, the difference between 11 personnel and the next highest for each team is more than 20 percent for all but three teams:
- Baltimore Ravens – 11 personnel (39%) vs 12 personnel (35%)
- San Francisco 49ers – 11 personnel (47%) vs. 21 personnel (31%)
- New England Patriots – 11 personnel (43%) vs. 21 personnel (24%)
Teams who can now find players at the running back and tight end positions who excel at the secondary and tertiary required skillsets (pass-blocking and receiving) create matchup advantages you’ll see in the personnel groupings below.

Highest personnel usages across the league
11 Personnel (1 RB, 1 TE, 3 WRs – NFL average: 58%)
1. Los Angeles Rams – 80%
Not only did head coach Sean McVay change the culture in Rams country, he also greatly changed their offensive dynamics. While still above league average in 2016 (65 percent 11 personnel vs. 59 percent NFL average), the additions of Robert Woods (83.2 grade), Sammy Watkins (76.2) and rookie Cooper Kupp (81.2) in addition to Todd Gurley (No. 1 RB – 92.0 grade) led the Rams to use 11 personnel on a league-leading 80 percent of plays. Given the presence of Gurley, among other factors, the Rams were also less likely to throw the ball compared to the rest of the league out of their 1-RB sets:
- 11 personnel – 63 percent of plays were passes compared to 72 percent NFL average
- 12 personnel (12% of plays) – 37 percent pass compared to 52 percent NFL average
2. Detroit Lions – 74%
3. Miami Dolphins – 74%
4. Oakland Raiders – 71%
5. Pittsburgh Steelers & Cincinnati Bengals – 69%
_____
T27. San Francisco 49ers & Atlanta Falcons – 47%
29. Tennessee Titans – 43%
30. New England Patriots – 43%
31. Chicago Bears – 43%
Injuries at wide receiver and the addition of Mitchell Trubisky at quarterback led the Bears down a completely different personnel path in 2017. After consistently being in the mid-60s percentage-wise during the Jay Cutler era (65 percent 11 personnel in 2016 and 64 percent in 2015), the Bears were the only team in 2017 to use three different personnel groupings on at least 20 percent of their plays.
- 11 personnel – 43 percent
- 12 personnel – 22 percent (NFL average = 19%)
- 21 personnel – 22 percent (NFL average = 8%)
32. Baltimore Ravens – 39%
12 Personnel (1 RB, 2 TEs, 2 WRs – NFL average = 19%)
1. Baltimore Ravens – 35%
2. New York Giants – 29%
After operating out of 11 personnel almost exclusively in 2016 – to the tune of 957 out of 1,062 snaps (90.1 percent) – the Giants drafted Evan Engram (42.2 grade) and lowered their 11 personnel to 61 percent in 2017 while upping the 12 personnel to 29 percent. Engram essentially functioned as the third receiver, trying to create matchup problems for the defense. While Engram had some success last season as a rookie, the Giants hope he takes a leap in Year 2 and becomes the weapon the think he can be.
3. Indianapolis Colts – 28%
4. Kansas City Chiefs – 26%
Travis Kelce – our third-highest graded tight end in 2017 (87.8) – and his ability as a pass-catcher allows the Chiefs great flexibility in their personnel groupings. While the Chiefs’ two primary personnel groupings (11 & 12) are at exactly the league average of 77 percent, the presence of Kelce lets the Chiefs use more 12 personnel – and use it to throw. Compared to a league average of 52 percent passing plays out of 12 personnel, the Chiefs threw on 67 percent of 12 personnel plays, which is close to the league average of 72 percent for 11 personnel. This even extended to their 13 personnel (three tight ends) package, as the Chiefs threw 25 percent more than the NFL average out of traditionally run-oriented 13 personnel (58 percent passes compared to 33 percentNFL average).
5. Arizona Cardinals – 25%
_____
T26. Cleveland Browns, New York Jets & Oakland Raiders – 13%
29. Los Angeles Rams – 12%
T30. Houston Texans, Pittsburgh Steelers & Green Bay Packers – 11%
21 Personnel (2 RBs, 1 TE, 2 WRs – NFL average = 8%)
1. San Francisco 49ers – 31%
The Shanahan effect is very real. Kyle Shanahan’s offense is a throwback to the traditional “pro” style offense – I-formation with a fullback, halfback, tight end and two wide receivers. After running 11 personnel 76 percent of the time in 2016, Shanahan completely changed that of the 49ers in 2017 (only 47 percent 11 personnel). In fact, his offense has been No. 1 or No. 2 in the use of 21 personnel in each of the past three years, the previous two seasons coming while in Atlanta. Kyle Juszczyk (75.1 grade) led all fullbacks in snaps in 2017 and Patrick DiMarco was in the top three of fullback snaps the previous two seasons with Shanahan in Atlanta.
2. New England Patriots – 24%
3. Chicago Bears – 22%
4. Atlanta Falcons – 17%
5. Cleveland Browns – 16%
_____
T27. Cincinnati Bengals & Indianapolis Colts – three snaps
T29. Arizona Cardinals & Miami Dolphins – two snaps
T31. Los Angeles Rams & Washington Redskins – no snaps
13 Personnel (1 RB, 3 TEs, 1 WR – NFL average = 4%)
T1. Dallas Cowboys, Washington Redskins & Tennessee Titans – 9%
4. Baltimore Ravens – 7%
5. Philadelphia Eagles – 6%
Just like with Kelce above, Zach Ertz (82.5 grade) gives the Eagles a lot of options in the passing game. Add in Trey Burton (75.6 grade) and Brent Celek (43.6 grade) and the Eagles used three tight ends on 71 snaps in 2017. In addition, they used two of those three in 12 personnel above the NFL average (22 percent vs. 19 percent NFL average). We'll see if this continues now with Dallas Goedert added in place of Burton, who left for Chicago this offseason. And also like Kansas City, the Eagles were more likely to throw the ball than the rest of the league in their TE-heavy groups.
- 12 personnel – 64 percent of plays were passes vs. 52 percent NFL average
- 13 personnel – 38 percent of plays were passes vs. 33 percent NFL average
22 Personnel (2 RBs, 2 TEs, 1 WR – NFL average = 4%)
1. Baltimore Ravens – 11%
2. Minnesota Vikings – 10%
The Ravens and Vikings were the only two teams in 2017 to use 22 personnel on at least 100 snaps.
3. Jacksonville Jaguars – 8%
4. Dallas Cowboys – 7%
5. New England Patriots – 7%
10 Personnel (1 RB, 0 TEs, 4 WRs – NFL average = 1%)
1. Arizona Cardinals – 13 %
The only team to highlight here because they are the only NFL team that uses this personnel grouping on a consistent basis. The never-aging Larry Fitzgerald (85.3 grade), Jaron Brown (50.5) and J.J. Nelson (48.4) were three of the four wide receivers on almost all of Arizona’s 149 snaps in this package. Interestingly, since 2008, this personnel grouping has been less than five percent of NFL snaps.

2017 Summary of All Teams’ Personnel Groupings
|
Team |
No. 1 Group (11 personnel for all) | No. 2 Group | No. 3 Group
(only if > 100 snaps) |
| Arizona Cardinals | 50% | 12 personnel – 25% | 10 personnel – 13% |
| Atlanta Falcons | 47 % | 12 personnel – 20 % | 21 personnel – 17% |
| Baltimore Ravens | 39% | 12 personnel – 35% | 22 personnel – 11% |
| Buffalo Bills | 53% | 12 personnel – 16% | 21 personnel – 15% |
| Carolina Panthers | 48% | 12 personnel – 22% | 21 personnel – 13% |
| Chicago Bears | 43% | 12 personnel – 22% | 21 personnel – 22% |
| Cincinnati Bengals | 69% | 12 personnel – 21% | |
| Cleveland Browns | 63% | 21 personnel – 16% | 12 personnel – 13% |
| Dallas Cowboys | 61% | 12 personnel – 14% | |
| Denver Broncos | 66% | 12 personnel – 15% | |
| Detroit Lions | 74% | 12 personnel – 18% | |
| Green Bay Packers | 65% | 12 personnel – 11% | |
| Houston Texans | 55% | 12 personnel – 11% | 21 personnel – 9% |
| Indianapolis Colts | 65% | 12 personnel – 28% | |
| Jacksonville Jaguars | 53% | 12 personnel – 16% | 21 personnel – 14% |
| Kansas City Chiefs | 51% | 12 personnel – 26% | |
| Los Angeles Chargers | 56% | 12 personnel – 22% | |
| Los Angeles Rams | 80% | 12 personnel – 12% | |
| Miami Dolphins | 74% | 12 personnel – 18% | |
| Minnesota Vikings | 55% | 12 personnel – 20% | 22 personnel – 10% |
| New England Patriots | 43% | 21 personnel – 24% | 12 personnel – 17% |
| New Orleans Saints | 48% | 12 personnel – 16% | 21 personnel – 12% |
| New York Giants | 61% | 12 personnel – 29% | |
| New York Jets | 62% | 12 personnel – 13% | |
| Oakland Raiders | 71% | 12 personnel – 13% | |
| Philadelphia Eagles | 65% | 12 personnel – 22% | |
| Pittsburgh Steelers | 69% | 12 personnel – 11% | |
| San Francisco 49ers | 47% | 21 personnel – 31% | 12 personnel – 15% |
| Seattle Seahawks | 65% | 12 personnel – 16% | |
| Tampa Bay Buccaneers | 62% | 12 personnel – 23% | |
| Tennessee Titans | 43% | 12 personnel – 21% | |
| Washington Redskins | 65% | 12 personnel – 24% |