
Three quarterbacks were selected within the first six picks of the 2020 NFL Draft, and we expected all of them to start sooner rather than later. Their respective teams certainly didn’t disappoint us in that regard, though the Philadelphia Eagles did surprise us by starting Jalen Hurts for multiple games at the end of the season due to Carson Wentz‘s struggles.
The question is, what have we learned from the play of these first-year quarterbacks?
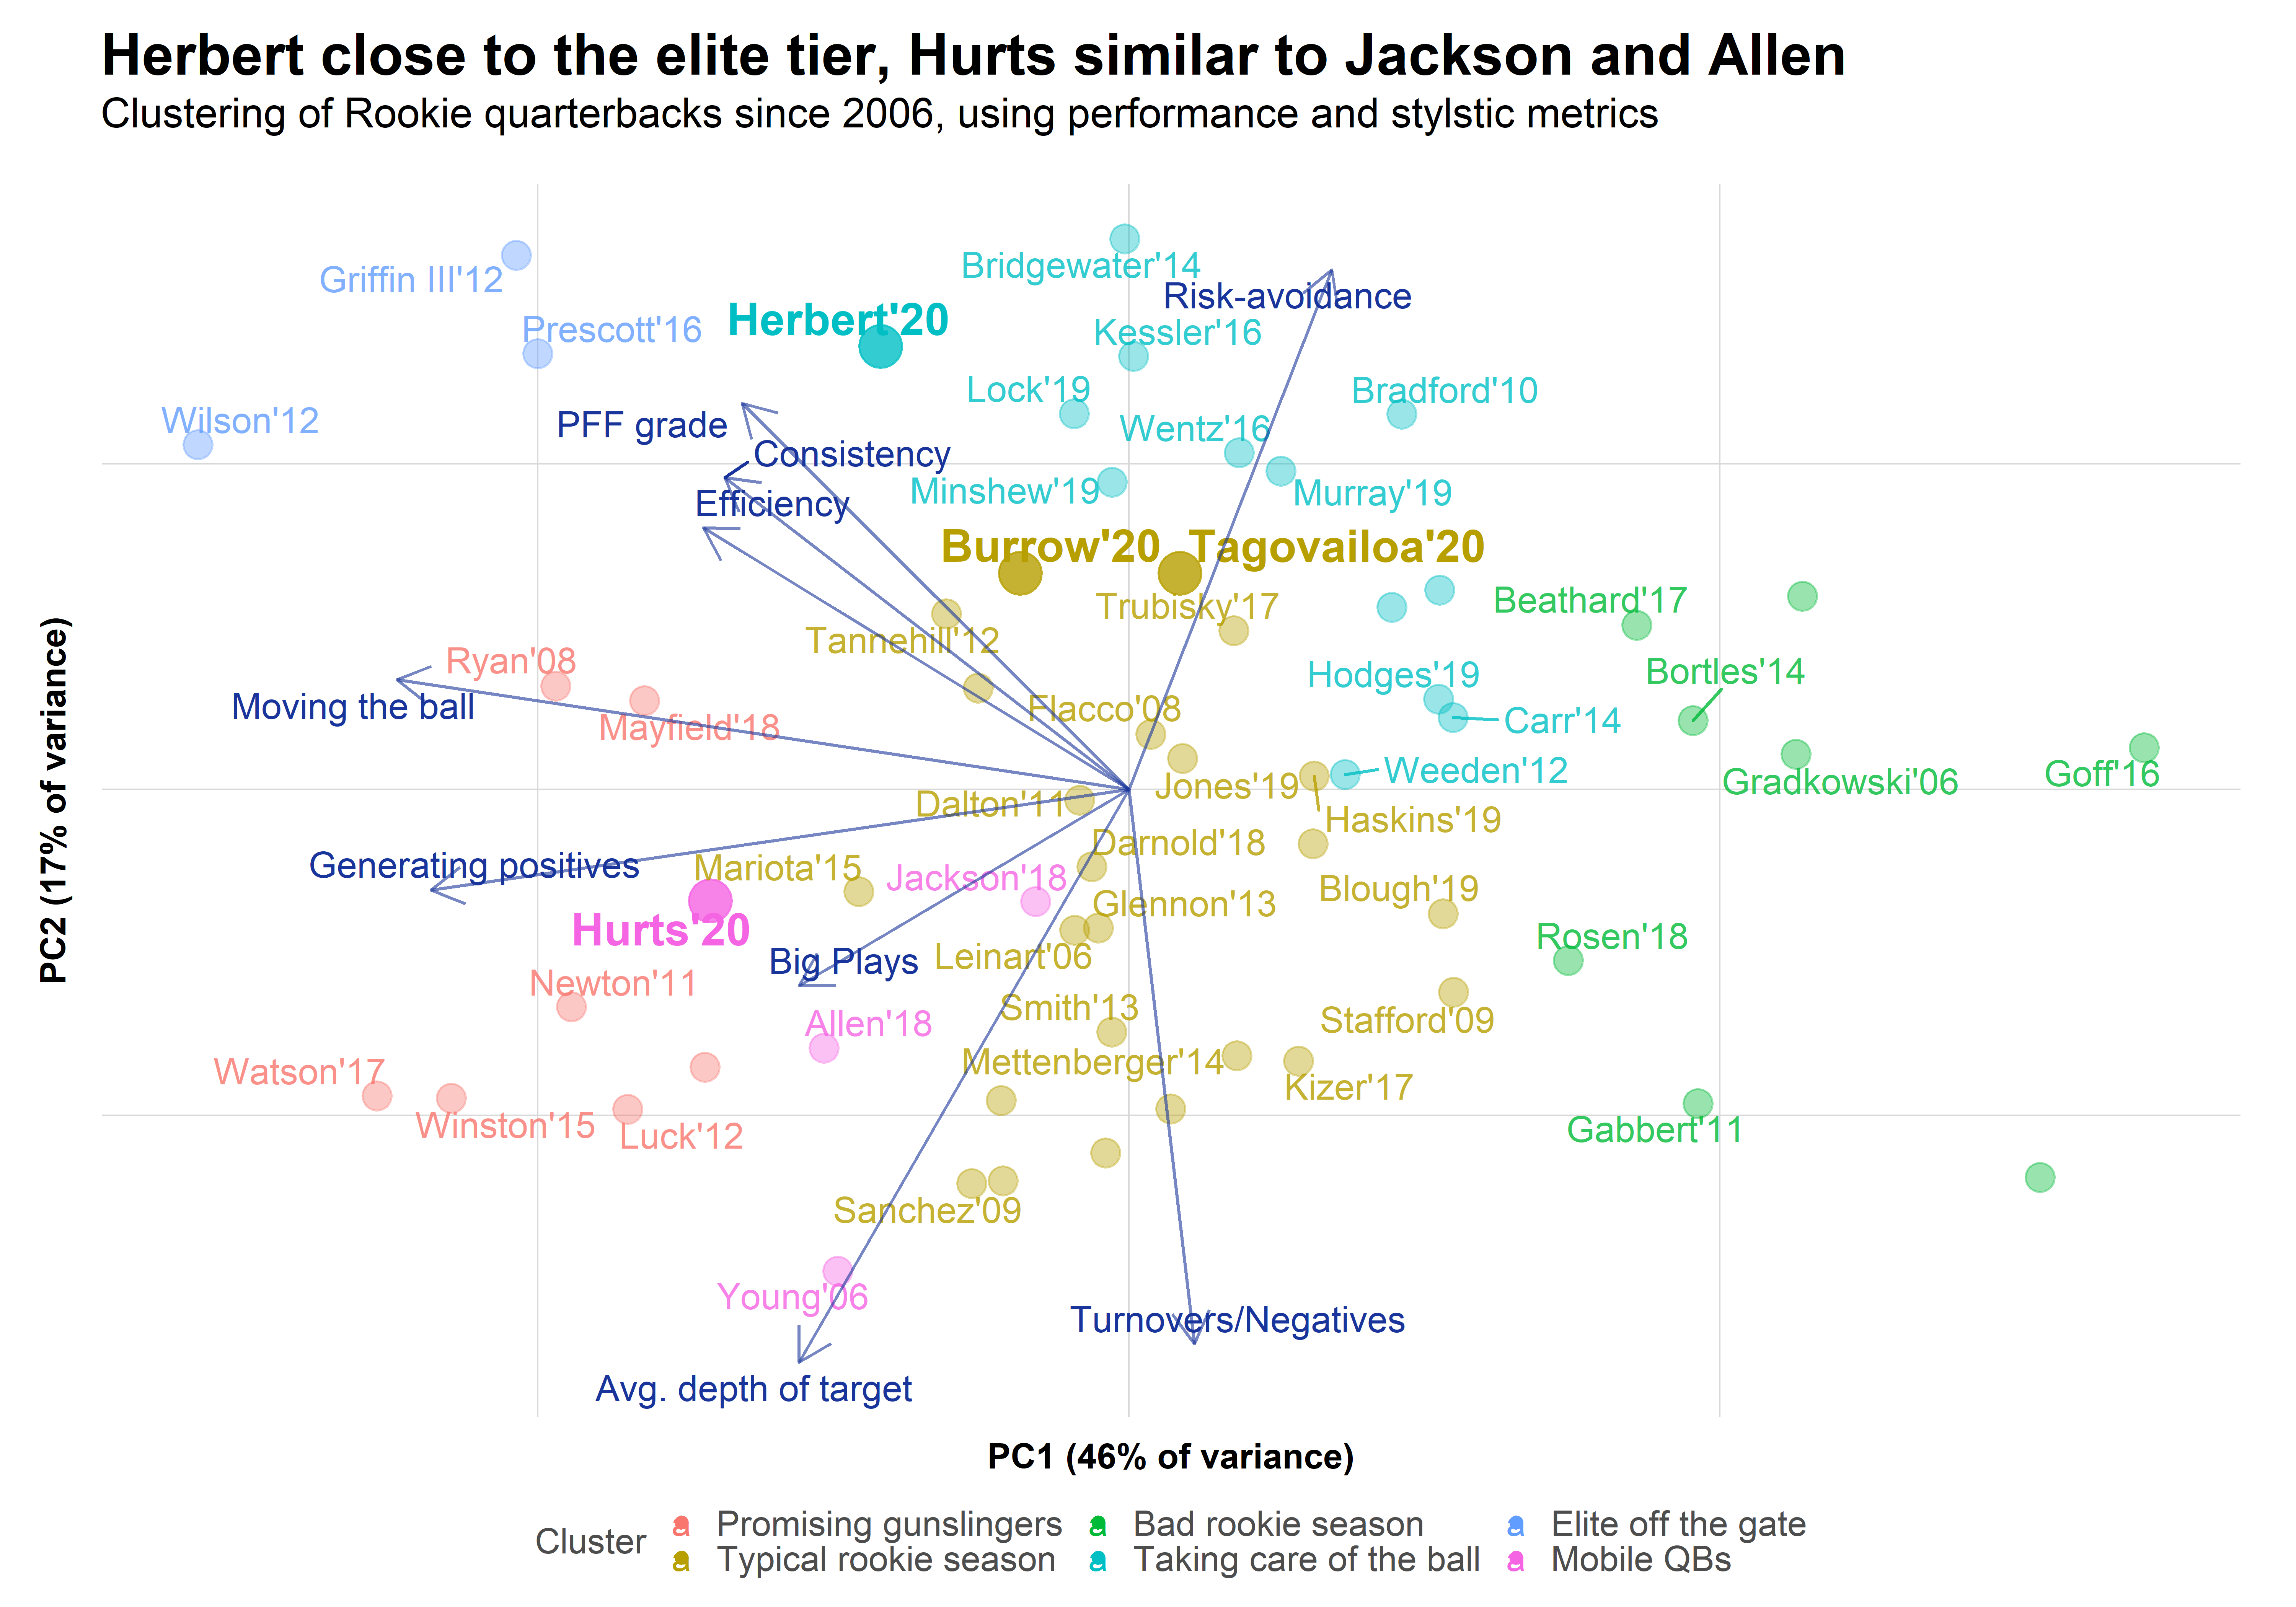
Los Angeles Chargers quarterback Justin Herbert undoubtedly showed the most promise with one of the best rookie seasons in recent history while Joe Burrow confirmed that he was worthy of a first-overall pick before his season-ending injury, and while Tua Tagovailoa and Hurts both had their moments, they also made typical rookie mistakes and fell to the usual shortcomings.
In this article, we want to use our rich data set to quantify their seasons and place them in context against other rookie seasons since 2006. We will use a clustering algorithm — as used by our own Eric Eager and George Chahrouri — to classify and visualize the statistical profile from both a performance and stylistic standpoint.
Additionally, we will use Bayesian forecasting, a technique often used by my colleagues, to get an idea of the distribution of outcomes for the four rookie quarterbacks as well as an understanding of where they stand relative to their former peers from a pure performance angle.

QB clustering: Herbert close to elite, Hurts shows potential
The goal of quarterback clustering is to reduce the complexity of all the information we have about quarterbacks. In total, we use 16 different features of quarterback play. Some of them, such as PFF grade, expected points added (EPA) per play or net yards per play, describe performance. Others, such as average depth of target (aDOT), time to throw, percentage of yards gained on deep throws or the percentage of dropbacks that end in scrambles, describe playstyle.
Since it’s impossible to capture and visualize 16 features of quarterback play at once, we use a dimensionality reduction algorithm to describe the effect of all 16 features in as few components as possible. We then use a clustering algorithm to classify all 59 rookie seasons with at least 150 dropbacks since 2006 into six different clusters, as presented in the following chart.
Already have a subscription? Log In
![]()
DOMINATE FANTASY FOOTBALL & BETTING WITH AI-POWERED DATA & TOOLS TRUSTED BY ALL 32
 Unlimited Fantasy League Sync
Fantasy Start/Sit Line-Up Optimizer & Waiver Wire
WR-CB & OL-DL Matchups, PFF Player Grades, & Premium Stats 2.0 Tools
Nathan Jahnkes Rankings - #1 Most Accurate Last 70 Weeks
PFF Best Bets, Player Props, & Power Ranking Tools
NFL Mock Draft Sim with Trades & Draft Grades
Unlimited Fantasy League Sync
Fantasy Start/Sit Line-Up Optimizer & Waiver Wire
WR-CB & OL-DL Matchups, PFF Player Grades, & Premium Stats 2.0 Tools
Nathan Jahnkes Rankings - #1 Most Accurate Last 70 Weeks
PFF Best Bets, Player Props, & Power Ranking Tools
NFL Mock Draft Sim with Trades & Draft Grades