Many of the things that significantly impact the outcome of football games have a great deal of variance when measured either year-over-year or versus an expectation.
When projecting how teams will do in 2020, it’s important to look back at 2019 and see which teams were particularly lucky or unlucky in these kinds of situations, as we should expect a team’s luck to be closer to the mean in 2020.
Subscribe to PFF's EDGE or ELITE subscriptions to get access to the following tools, charts, etc.
– All Premium Article Content
– Fantasy Football Rankings & Projections
– Fantasy Football Draft Guide, Cheat Sheets & Advanced Stats
– Fantasy Football Mock Draft Tool (DraftMaster)
– Fantasy Football Strength of Schedule Matrix
– NFL Player Grades
– NFL Premium Stats
Here we’ll be examining several of these aspects of the game: interceptions, field goals, fumble recoveries and defensive pass interference penalties.
INTERCEPTIONS (VS. TURNOVER-WORTHY PASS ATTEMPTS)
A quarterback’s decision-making and accuracy on a throw tell us the measure of his skill on the play — not the box score stat of whether an interception actually occurred. To separate the two, we can use PFF’s turnover-worthy plays metric, which is stable from year-to-year. Here, we’ll limit the analysis to dropbacks that include a pass attempt in order to focus on whether a given pass merited an interception.
We can use this data to examine how many interceptions a quarterback was expected to throw vs. how many interceptions he actually threw. For a given team, we want to examine both sides of the ball by looking at these values for when the team was on defense and subtract when the team was on offense (so a higher number is better for the team).
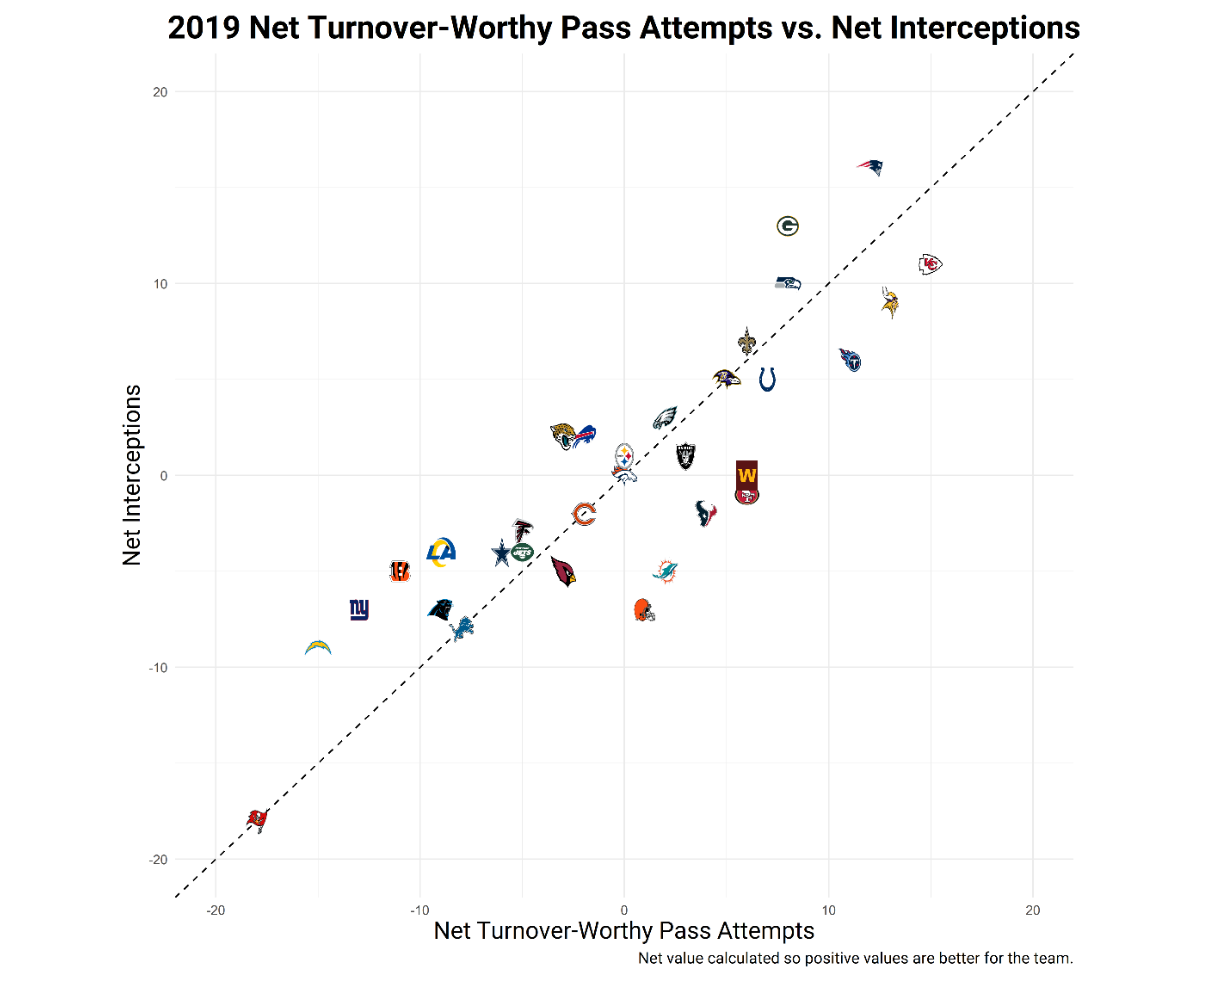
Teams above the dashed line such as the New York Giants and Green Bay Packers benefited from favorable interception variance, while the teams below it like the Cleveland Browns and San Francisco 49ers should improve upon this next year.
FIELD GOALS (ABOVE EXPECTATION)
As PFF’s Timo Riske demonstrated, while individual kickers can be skilled, a kicker’s field goals above expectation in one season is not predictive of how he will perform the following season. (Except, perhaps, if your kicker’s name is Justin Tucker.)
The following chart reproduces Riske's analysis but looks at team kicking rather than an individual kicker. Additionally, we’ll look at both sides of the ball by taking a team’s own field goals above expectation and subtract the field goals above expectation of the opposing team for a net metric. (There is little signal here, the R^2 of this for a team year-over-year is only 0.01.) Teams above the line were fortunate, teams below it were not.
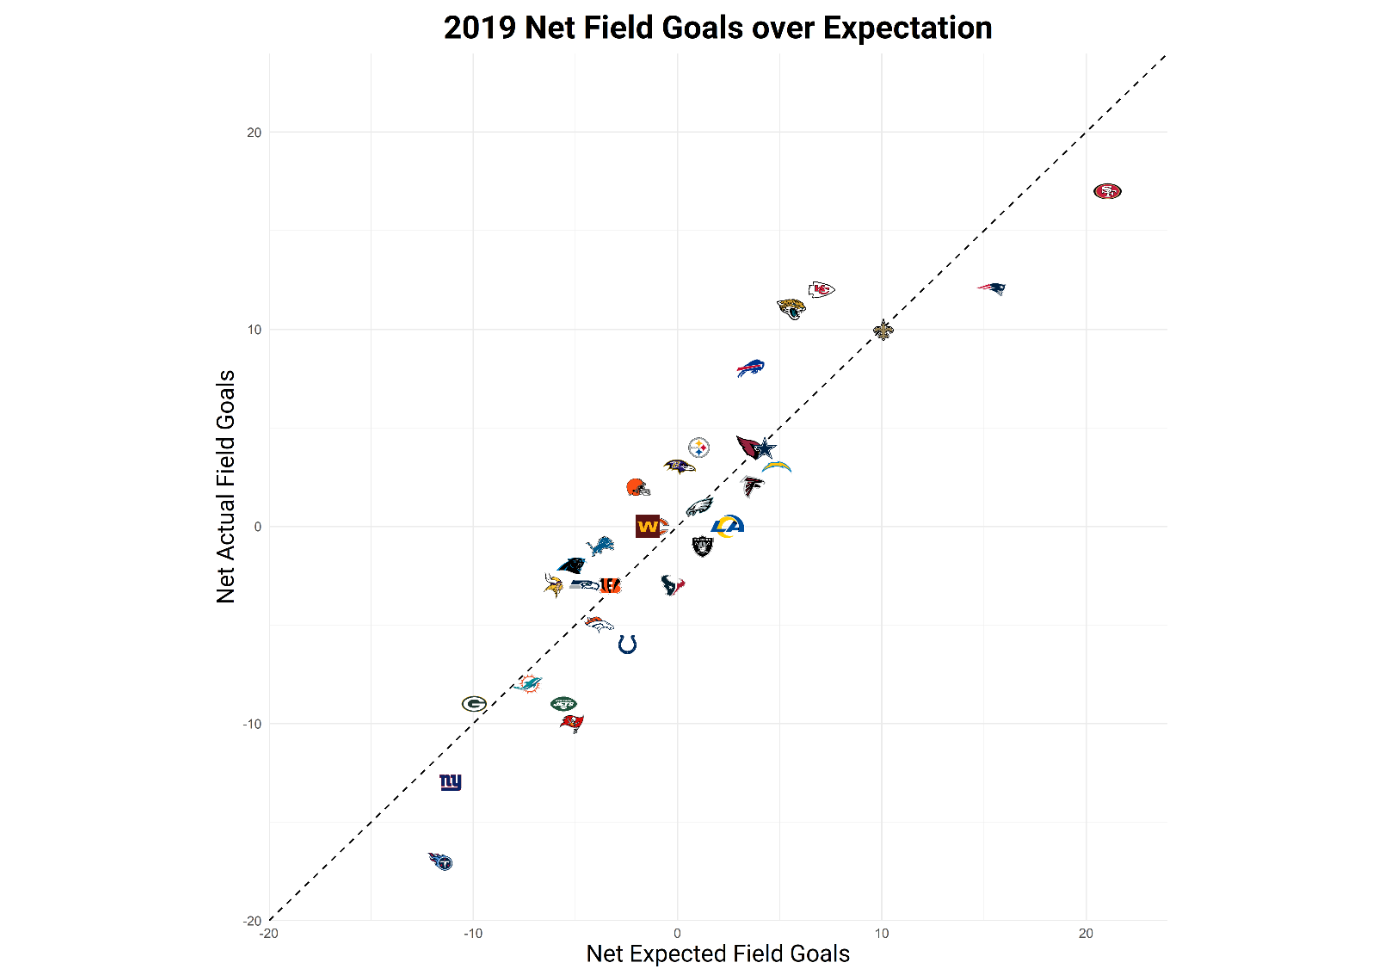
The team benefiting most from field goal variance, the Jacksonville Jaguars, had almost 5.5 net field goals above expectation. That works out to a difference of 16.5 points, which can easily affect a team’s record given the number of close games in the NFL.
FUMBLES
Some players are more prone to fumble than others, but once a player has fumbled, there is variance in the recovery. (The year-over-year R^2 of the number of times a team fumbles the ball is 0.11, while it’s less than 0.001 for recovery rate.) This data makes sense, as once a football is loose, it can bounce in any direction and any player can easily grab it.
Naturally, some teams are going to be lucky and recover most of the fumbles in their games, while other teams will be unlucky when their opponents recover the majority. In both cases, teams are more likely to have a recovery rate closer to 50% the following season.
We’ll examine each team’s 2019 net fumble recoveries, defined as their fumble recoveries minus those of their opponents, in the table after the next section.
DEFENSIVE PASS INTERFERENCE PENALTIES
Defensive pass interference penalties are a huge benefit to the offense, providing an automatic first down and a spot foul — they average an EPA of 1.70. They’re also high-variance, in part because of the inherently subjective judgment required by game officials in determining whether to throw the flag.
While the number of accepted penalties in the aggregate show some year-over-year signal (R^2 = 0.18 for one’s own penalties, R^2 = 0.11 for opponent penalties), there is very little when focusing on defensive pass interference in particular (R^2 = 0.03 for both).
Looking in the table below at a team’s net defensive pass interference penalties — defined as those committed by the opposing defense while on offense minus those committed on defense — will help us understand which teams benefited from this variance.
WHO GOT (UN)LUCKY
The following table shows every team’s value for all four of the metrics above. Positive values mean the team was fortunate in that metric, while negative values mean the team was not. This table allows us to identify teams that were particularly lucky or unlucky across the metrics.
| Team | Net INT-TWPA | Net FGs Over Exp | Net Fumble Rec | Net DPI |
| ARZ | -2 | 0.4 | -6 | -2 |
| ATL | 2 | -1.7 | -5 | 2 |
| BLT | 0 | 2.9 | 5 | -4 |
| BUF | 4 | 4.5 | 3 | 1 |
| CAR | 2 | 3.2 | -5 | -4 |
| CHI | 0 | 1.1 | 2 | 3 |
| CIN | 6 | 0.3 | -6 | 8 |
| CLV | -8 | 3.9 | -5 | 4 |
| DAL | 2 | -0.3 | 8 | -2 |
| DEN | 0 | -1.2 | 5 | 2 |
| DET | 0 | 2.8 | -3 | -2 |
| GB | 5 | 1 | -8 | 10 |
| HST | -6 | -2.8 | 8 | -5 |
| IND | -2 | -3.5 | -4 | 4 |
| JAX | 5 | 5.4 | -4 | -3 |
| KC | -4 | 4.9 | -6 | -1 |
| LA | 5 | -2.4 | 2 | 2 |
| LAC | 6 | -1.8 | -11 | 7 |
| LV | -2 | -2.2 | 2 | -10 |
| MIA | -7 | -0.7 | -5 | 0 |
| MIN | -4 | 3.1 | 9 | 1 |
| NE | 4 | -3.3 | -4 | 6 |
| NO | 1 | -0.1 | 10 | -5 |
| NYG | 6 | -1.9 | 0 | -6 |
| NYJ | 1 | -3.4 | -6 | -3 |
| PHI | 1 | -0.1 | -3 | -3 |
| PIT | 1 | 3 | 12 | 3 |
| SEA | 2 | 1.6 | 5 | -2 |
| SF | -7 | -4.1 | 1 | 0 |
| TB | 0 | -4.8 | 4 | 1 |
| TEN | -5 | -5.3 | 5 | -6 |
| WAS | -6 | 1.5 | 0 | 4 |
For example, the Pittsburgh Steelers were extremely lucky on fumble recoveries in particular and at least somewhat lucky on the other metrics. Unfortunately, the Steelers did suffer a horrible piece of luck not captured here — the early-season injury to quarterback Ben Roethlisberger. His return has to be measured against regression in these metrics.
Another lucky team in these metrics was the Buffalo Bills — the team was fortunate in every category, but particularly with respect to field goals above expectation. We cannot expect the Bills be as lucky again in 2020.
On the other side of variance on these metrics are two other AFC East teams, the Miami Dolphins and New York Jets. Both are quite negative on several metrics while none show good fortune. This is unlikely to go against them again in 2020. The San Francisco 49ers are in a similar camp, with particularly bad interception luck.
The Tennessee Titans had noticeably bad luck on interceptions, field goals and defensive pass interference penalties. While this is partially offset by their good fortune in fumble recoveries, on balance we would expect the other factors in combination to be worth more.
FINAL THOUGHTS
These metrics don’t and aren’t meant to comprise all of a team’s luck, let alone all of the offseason activity we also must take into account when projecting a team from one season to the next. But this type of analysis allows us to examine teams that benefited from variance in ways we might not have realized when looking back at a season and project more accurately in the next one.
