Offseason is projection season. Just yesterday, we projected every starting quarterback’s chances at winning the MVP award. Obviously, what the Associated Press voters will think is not necessarily what we at PFF will think, which is why we mostly looked at projected quarterback efficiency as well as projected quarterback wins to come up with MVP odds.
When we rank quarterbacks at PFF, we put a lot of emphasis on the PFF grades that come with a lot of predictive power. In this article, we will use the same methods as yesterday but will rank quarterbacks based on a 50:50 blend of projected PFF passing grade and projected expected points added (EPA) per play.
A key feature of this article will be that we not only rank quarterbacks but also point out the difference between quarterbacks in terms of uncertainty. Other than giving point estimates, we will answer questions like, what is the chance that a given quarterback will be a top-10 quarterback in 2020?
[Editor’s note: Subscribe to PFF ELITE today to gain access to PFF’s Premium Stats and new Player Grades experience in addition to the 2020 NFL Draft Guide, 2020 Fantasy Rookie Scouting Report, PFF Greenline, all of PFF’s premium article content and more.]
Bayesian Updating helps improve predictions
As we’ve done before, we are using Bayesian Updating as the basis of our analysis, which yields a career posterior mean and a posterior distribution (which describes the uncertainty) for each quarterback. This helps us to get better predictions compared to using just the data from last season.
Again, we will use a blend of PFF passing grade and EPA per play to enhance our projections. The difference to previous analyses is that we won’t weigh each play of a given quarterback the same. This is a crucial adjustment when comparing quarterbacks like Matt Ryan or Tom Brady — who have been in the league for a long time — to a young quarterback like Lamar Jackson, who has played only for one and a half years.
Furthermore, we will also put the posterior means back into models that predict performance, as predicting 2020 performance is precisely our goal in this exercise. These models will incorporate additional features, as we will discuss in the following section.
Recent performance should be weighted more
Weighting recent performance more is very intuitive, but sometimes intuition can fail us. Not so in this case, however, as the numbers back it up: When it comes to predicting next season's PFF passing grade by using the PFF passing grade in the previous two seasons, the most recent season correlates stronger with the performance in that next season, and a linear model yields a higher coefficient for the most recent season.
The same effect is to be found within a season, as the second half of the last season is more predictive for the next season than the first half of the last season. This is why we exponentially downgrade older data based on how many weeks it lies in the past.
The magnitude of the decay is chosen such that performance exactly one year ago is weighted at 70%. This also means that Week 1 of 2019 is weighted at only 87% compared to the Super Bowl. The 2015 season is weighted at only 12 to 17%.
Not throwing away data is important, but overreacting to Nick Foles’ 2013 season in our projections for 2020 is just as bad. This is why weighting older data to a lesser degree is the perfect balance between ignoring and overweighting old data.
Second-year QBs tend to fare better than their career estimates show us
When using a linear model to predict season performance with the career posterior mean from the Bayesian Updating technique (as explained above), adding another factor, one that takes into account whether or not the QB is in Year 2, adds to the predictive power of the model in a statistically significant way.
We found this effect for both PFF passing grade and EPA per play, just like we found it using PFF WAR before the draft. However, the effect seems to be only present for quarterbacks who have played some meaningful snaps, as we’ve found that widening the sample to quarterbacks who didn’t drop back at least 150 times in their rookie year lowered both the statistical significance and the magnitude of the effect.
The effect size is up to 0.025 EPA per play (the difference between the seventh- and 13th-best passing offense in 2019) and is stronger for highly drafted quarterbacks compared to quarterbacks with lower draft stocks, i.e., we expect Kyler Murray to have a stronger second-year leap than Drew Lock or Gardner Minshew.
Another consequence of this finding is that we are particularly forgiving of bad rookie seasons. While we give full credit for good rookie seasons (like Dak Prescott’s 2016 or Gardner Minshew’s 2019), we are heavily downweighting rookie seasons that are worse than the prior that came from the draft position (like Jared Goff’s 2016 or Kyler Murray’s 2019).
Older QBs tend to fare worse than their career estimates show us
We trained a GAM model for both EPA per play and PFF passing grade. This model predicts the performance in the next season based on the career posterior mean from the Bayesian technique, and it allows for a smooth term based on the age of the quarterback.
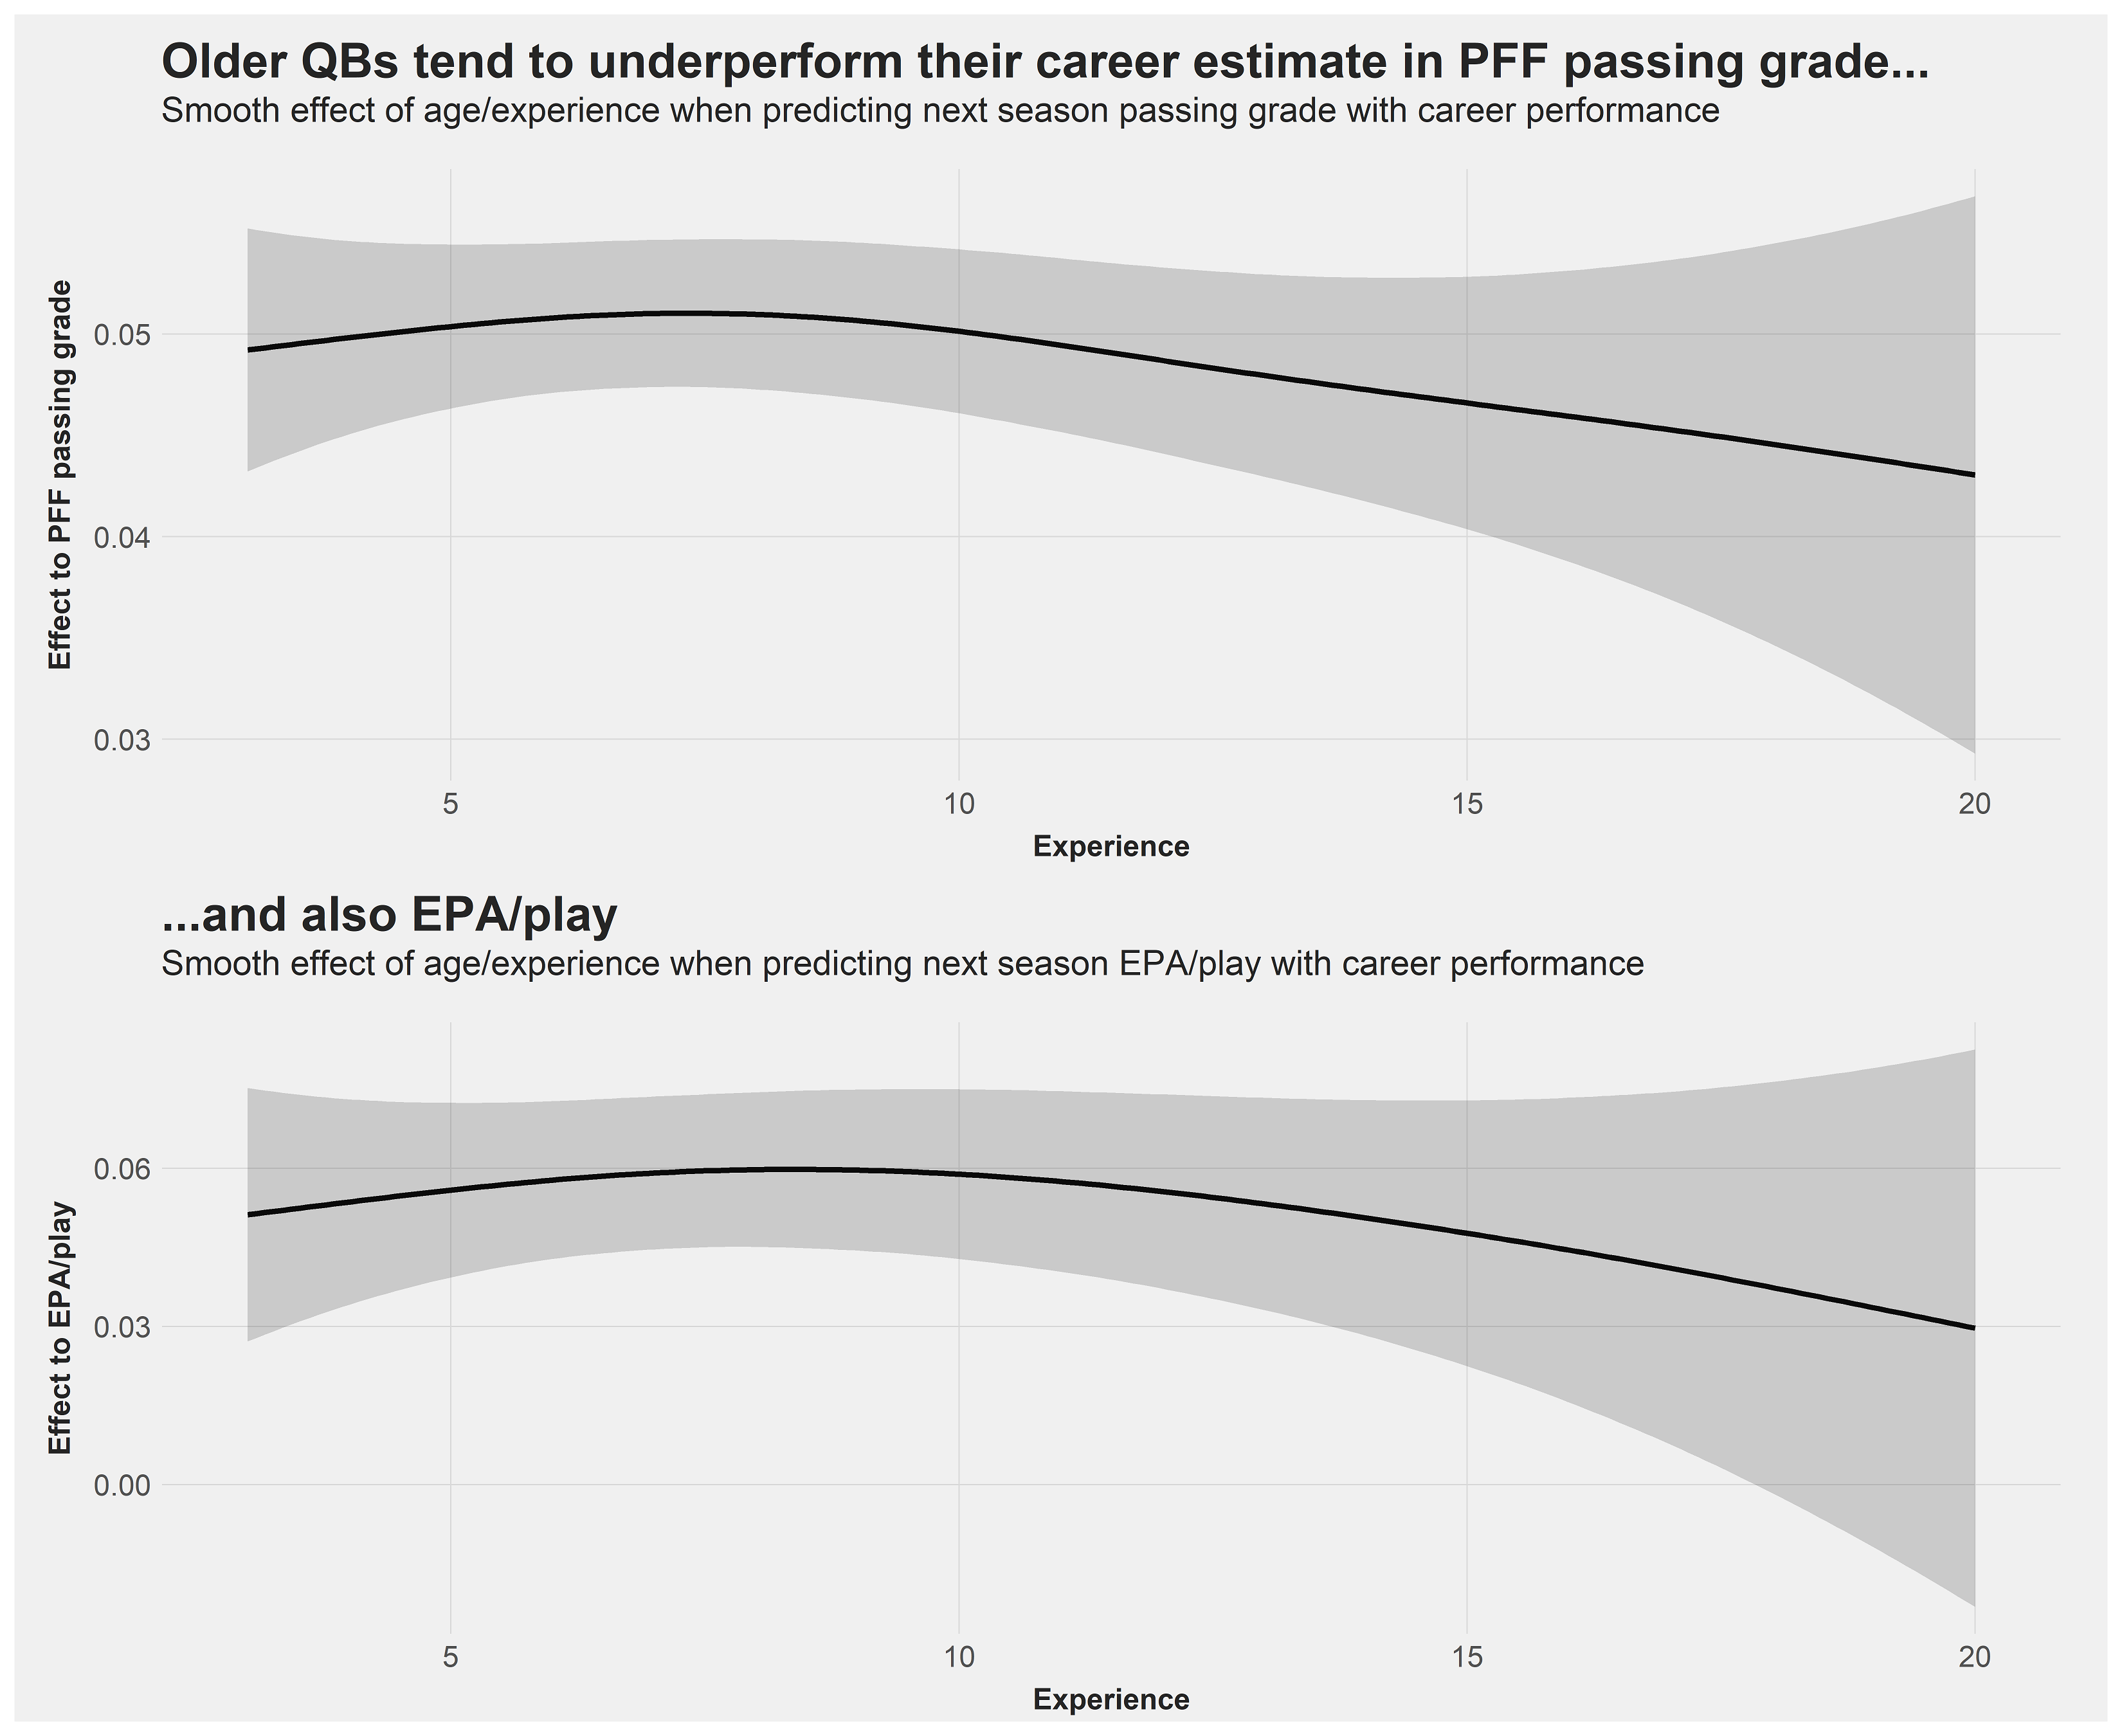
We find that quarterbacks tend to underperform their career performance in the next season once they’ve been in the league for roughly 10 years, and the effect grows stronger the older the quarterback becomes.
This doesn’t necessarily stem from a smooth decay of a quarterback’s skill, but more from the increasing probability that an older quarterback “falls off a cliff.” Nevertheless, it’s an effect we have to acknowledge in our projections.
The final rankings of the quarterbacks are the results of these two models — the career posterior means adjusted for age and experience, as discussed in the last two sections.
How do rookies fit in?
Rookies, of course, haven’t shown us anything in the NFL, but PFF’s Eric Eager has done a remarkable job with college-to-pro projections, allowing us to project rookie year passing grade.
To also account for what the NFL thinks about a rookie, we use a blend of our college-to-pro projections and draft-position priors. For example, Tua Tagovailoa and Justin Herbert enter the NFL with a similar draft-position prior because they were drafted back to back. Still, our projections think more highly of Tua, which is why he ranks above Herbert. The uncertainty for rookies is, of course, larger than for all other quarterbacks.
We should also note that the rookie rankings don’t necessarily describe how we project them to rank going forward in their careers. Rookies generally struggle in the first year, hence their projections for 2020 look worse than their career projections.
Incorporating seasonal variance
With the rankings set, we have to ask ourselves how much additional variance we have to add to our simulations when caring only about the 2020 NFL season.
To understand that, note that Tom Brady is the highest-graded quarterback in the PFF era, but even he has ranked outside the top 10 three times in his career since 2006. Over the last four years, Derek Carr ranked sixth, 27th, 25th and 11th in passing grade, further illustrating that quarterbacks tend to fluctuate from season to season.
The following charts show the distributions of the residuals of the two GAM models from above.
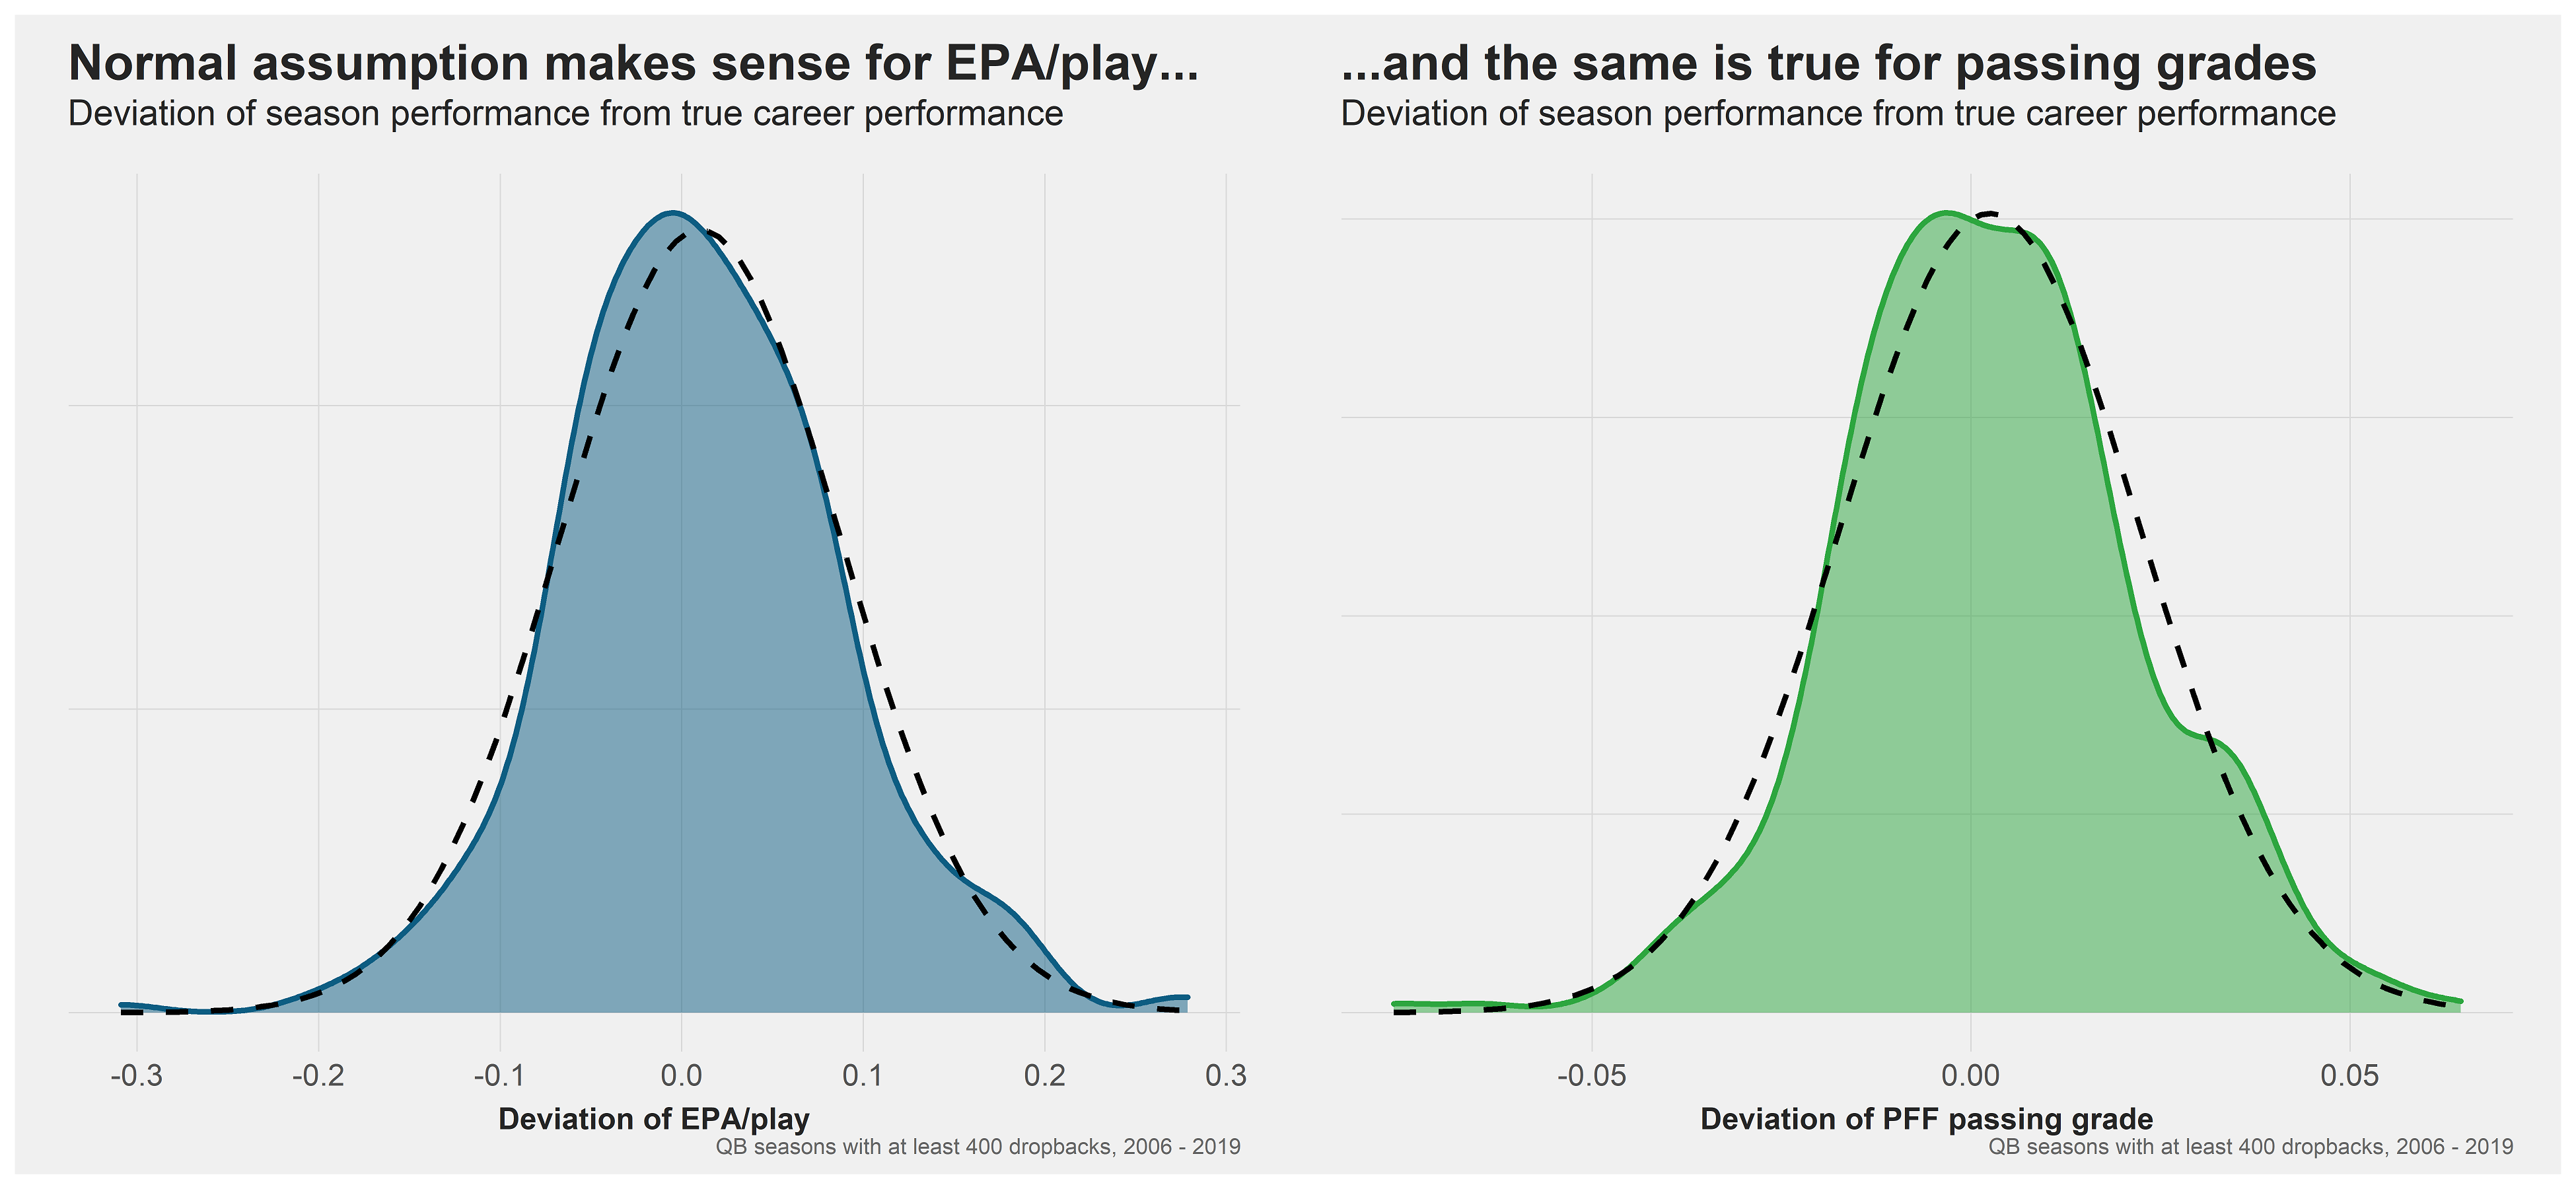
The deviation from the true estimated ability is normally distributed, hence all we need for our simulations is the standard deviation of these distributions.
It turns out that the seasonal variance is significant for quarterbacks who have started for several seasons, but that’s not the case for young quarterbacks. In other words, we are much more certain about Derek Carr’s true ability than about his 2020 performance. The following chart illustrates this phenomenon for Derek Carr and Kyler Murray.
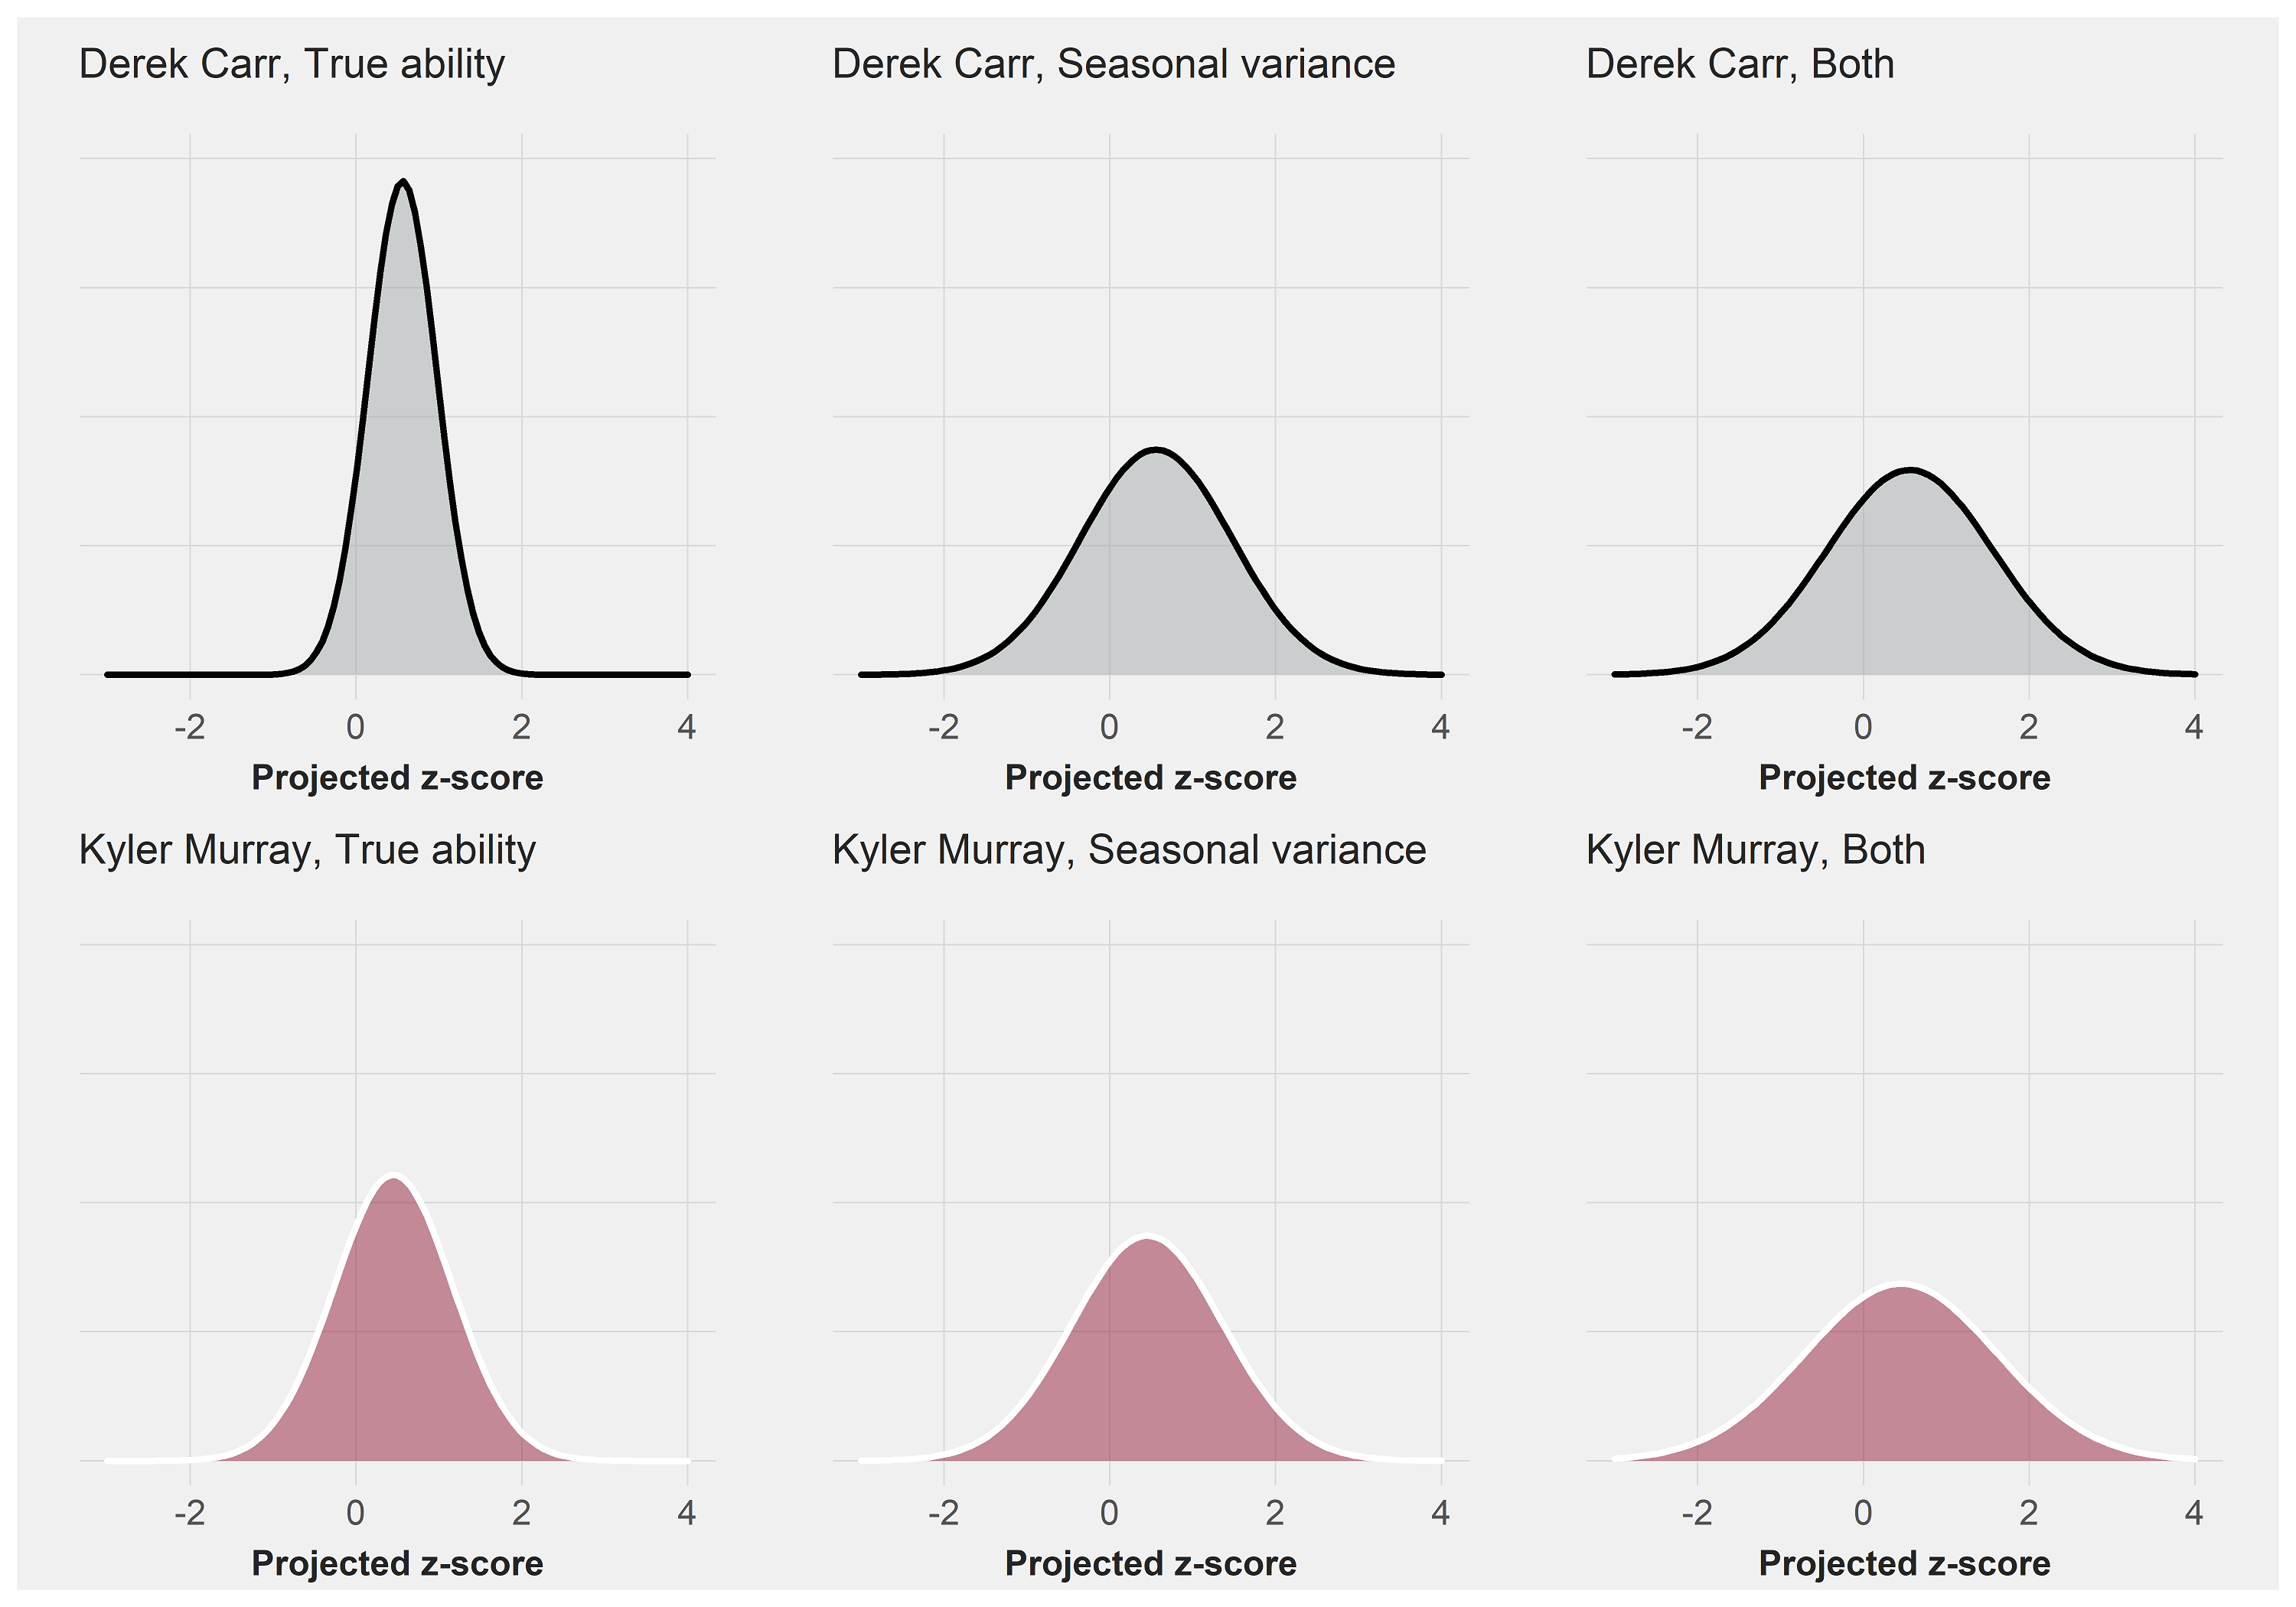
Murray and Carr are projected to have roughly the same estimated performance in 2020. However, Carr’s variance stems mostly from seasonal variance — he has been starting for six straight seasons and is as close to a known commodity in terms of true ability as they come in the NFL. Murray’s variance, however, stems from both our uncertainty about his true skill as an NFL quarterback and seasonal variance.
Consequently, Murray’s performance underlies greater variance in 2020, but the difference to Carr isn’t that large (note that the standard deviation isn’t additive, as it’s calculated as the square root of the sum of squares) because the seasonal variance dominates.
Nevertheless, Murray has a higher ceiling than Carr — despite having a slightly lower mean outcome — as we will see in the next section.
Final rankings
These are the final rankings in tabular form. They show a point estimate measured in a z-score among all NFL quarterbacks (including those who aren’t starters, which is why most starters are positive). Even more importantly, they also give an idea of the distribution by showing the median rank as well as the percentages at which the respective quarterback is the best, a top-five, a top-10, an upper-half or one of the worst quarterbacks in the league.
|
Chance of being… |
||||||||
|
Rank |
QB | Proj. z-score | Median
rank |
The best | Top- 5 | Top- 10 | Top- 16 | Among worst 5 |
| 1 | Patrick Mahomes | 2.4 | 3 | 29.6% | 69% | 87% | 95% |
0% |
|
2 |
Russell Wilson | 1.8 | 7 | 10.6% | 44% | 69% | 86% | 1% |
| 3 | Drew Brees | 1.6 | 8 | 7.5% | 37% | 62% | 82% |
1% |
|
4 |
Aaron Rodgers | 1.5 | 9 | 6.2% | 32% | 58% | 79% | 1% |
| 5 | Matt Ryan | 1.4 | 9 | 5.4% | 30% | 55% | 77% |
1% |
|
6 |
Lamar Jackson | 1.3 | 10 | 6.1% | 29% | 51% | 71% | 3% |
| 7 | Tom Brady | 1.3 | 11 | 3.9% | 25% | 49% | 72% |
2% |
|
8 |
Deshaun Watson | 1.0 | 14 | 2.6% | 17% | 37% | 60% | 5% |
| 9 | Ben Roethlisberger | 0.9 | 14 | 2.1% | 15% | 35% | 58% |
5% |
|
10 |
Philip Rivers | 0.9 | 14 | 1.9% | 15% | 35% | 58% | 5% |
| 11 | Dak Prescott | 0.9 | 15 | 1.9% | 15% | 34% | 57% |
5% |
|
12 |
Jimmy Garoppolo | 0.9 | 15 | 2.5% | 16% | 35% | 57% | 6% |
| 13 | Carson Wentz | 0.9 | 15 | 2.0% | 15% | 34% | 57% |
5% |
|
14 |
Matthew Stafford | 0.8 | 15 | 1.6% | 14% | 32% | 55% | 5% |
| 15 | Jared Goff | 0.8 | 16 | 1.6% | 13% | 31% | 53% |
6% |
|
16 |
Kirk Cousins | 0.7 | 17 | 1.2% | 11% | 27% | 49% | 7% |
| 17 | Ryan Tannehill | 0.6 | 18 | 1.1% | 9% | 24% | 45% |
10% |
|
18 |
Baker Mayfield | 0.6 | 18 | 1.1% | 10% | 24% | 45% | 10% |
| 19 | Derek Carr | 0.6 | 18 | 0.9% | 9% | 23% | 44% |
9% |
|
20 |
Kyler Murray | 0.5 | 19 | 1.4% | 10% | 23% | 41% | 14% |
| 21 | Ryan Fitzpatrick | 0.3 | 21 | 0.5% | 5% | 16% | 34% |
15% |
|
22 |
Tyrod Taylor | 0.3 | 21 | 0.6% | 6% | 17% | 34% | 17% |
| 23 | Daniel Jones | 0.2 | 21 | 1.1% | 8% | 19% | 35% |
19% |
|
24 |
Teddy Bridgewater | 0.2 | 21 | 0.7% | 6% | 17% | 33% | 18% |
| 25 | Dwayne Haskins | 0.1 | 22 | 1.1% | 7% | 17% | 32% |
23% |
|
26 |
Joe Burrow | 0.1 | 23 | 1.5% | 9% | 19% | 33% | 25% |
| 27 | Nick Foles | -0.1 | 25 | 0.2% | 3% | 9% | 22% |
28% |
|
28 |
Gardner Minshew | -0.1 | 25 | 0.2% | 3% | 9% | 22% | 28% |
| 29 | Drew Lock | -0.2 | 25 | 0.6% | 5% | 12% | 24% |
31% |
|
30 |
Josh Allen | -0.3 | 26 | 0.2% | 2% | 7% | 18% | 32% |
| 31 | Sam Darnold | -0.3 | 26 | 0.2% | 2% | 7% | 18% |
33% |
|
32 |
Tua Tagovailoa | -0.3 | 26 | 0.7% | 5% | 11% | 22% | 37% |
| 34 | Jarrett Stidham | -0.6 | 29 | 0.4% | 3% | 8% | 16% |
46% |
|
34 |
Justin Herbert | -0.7 | 29 | 0.3% | 3% | 7% | 15% |
47% |
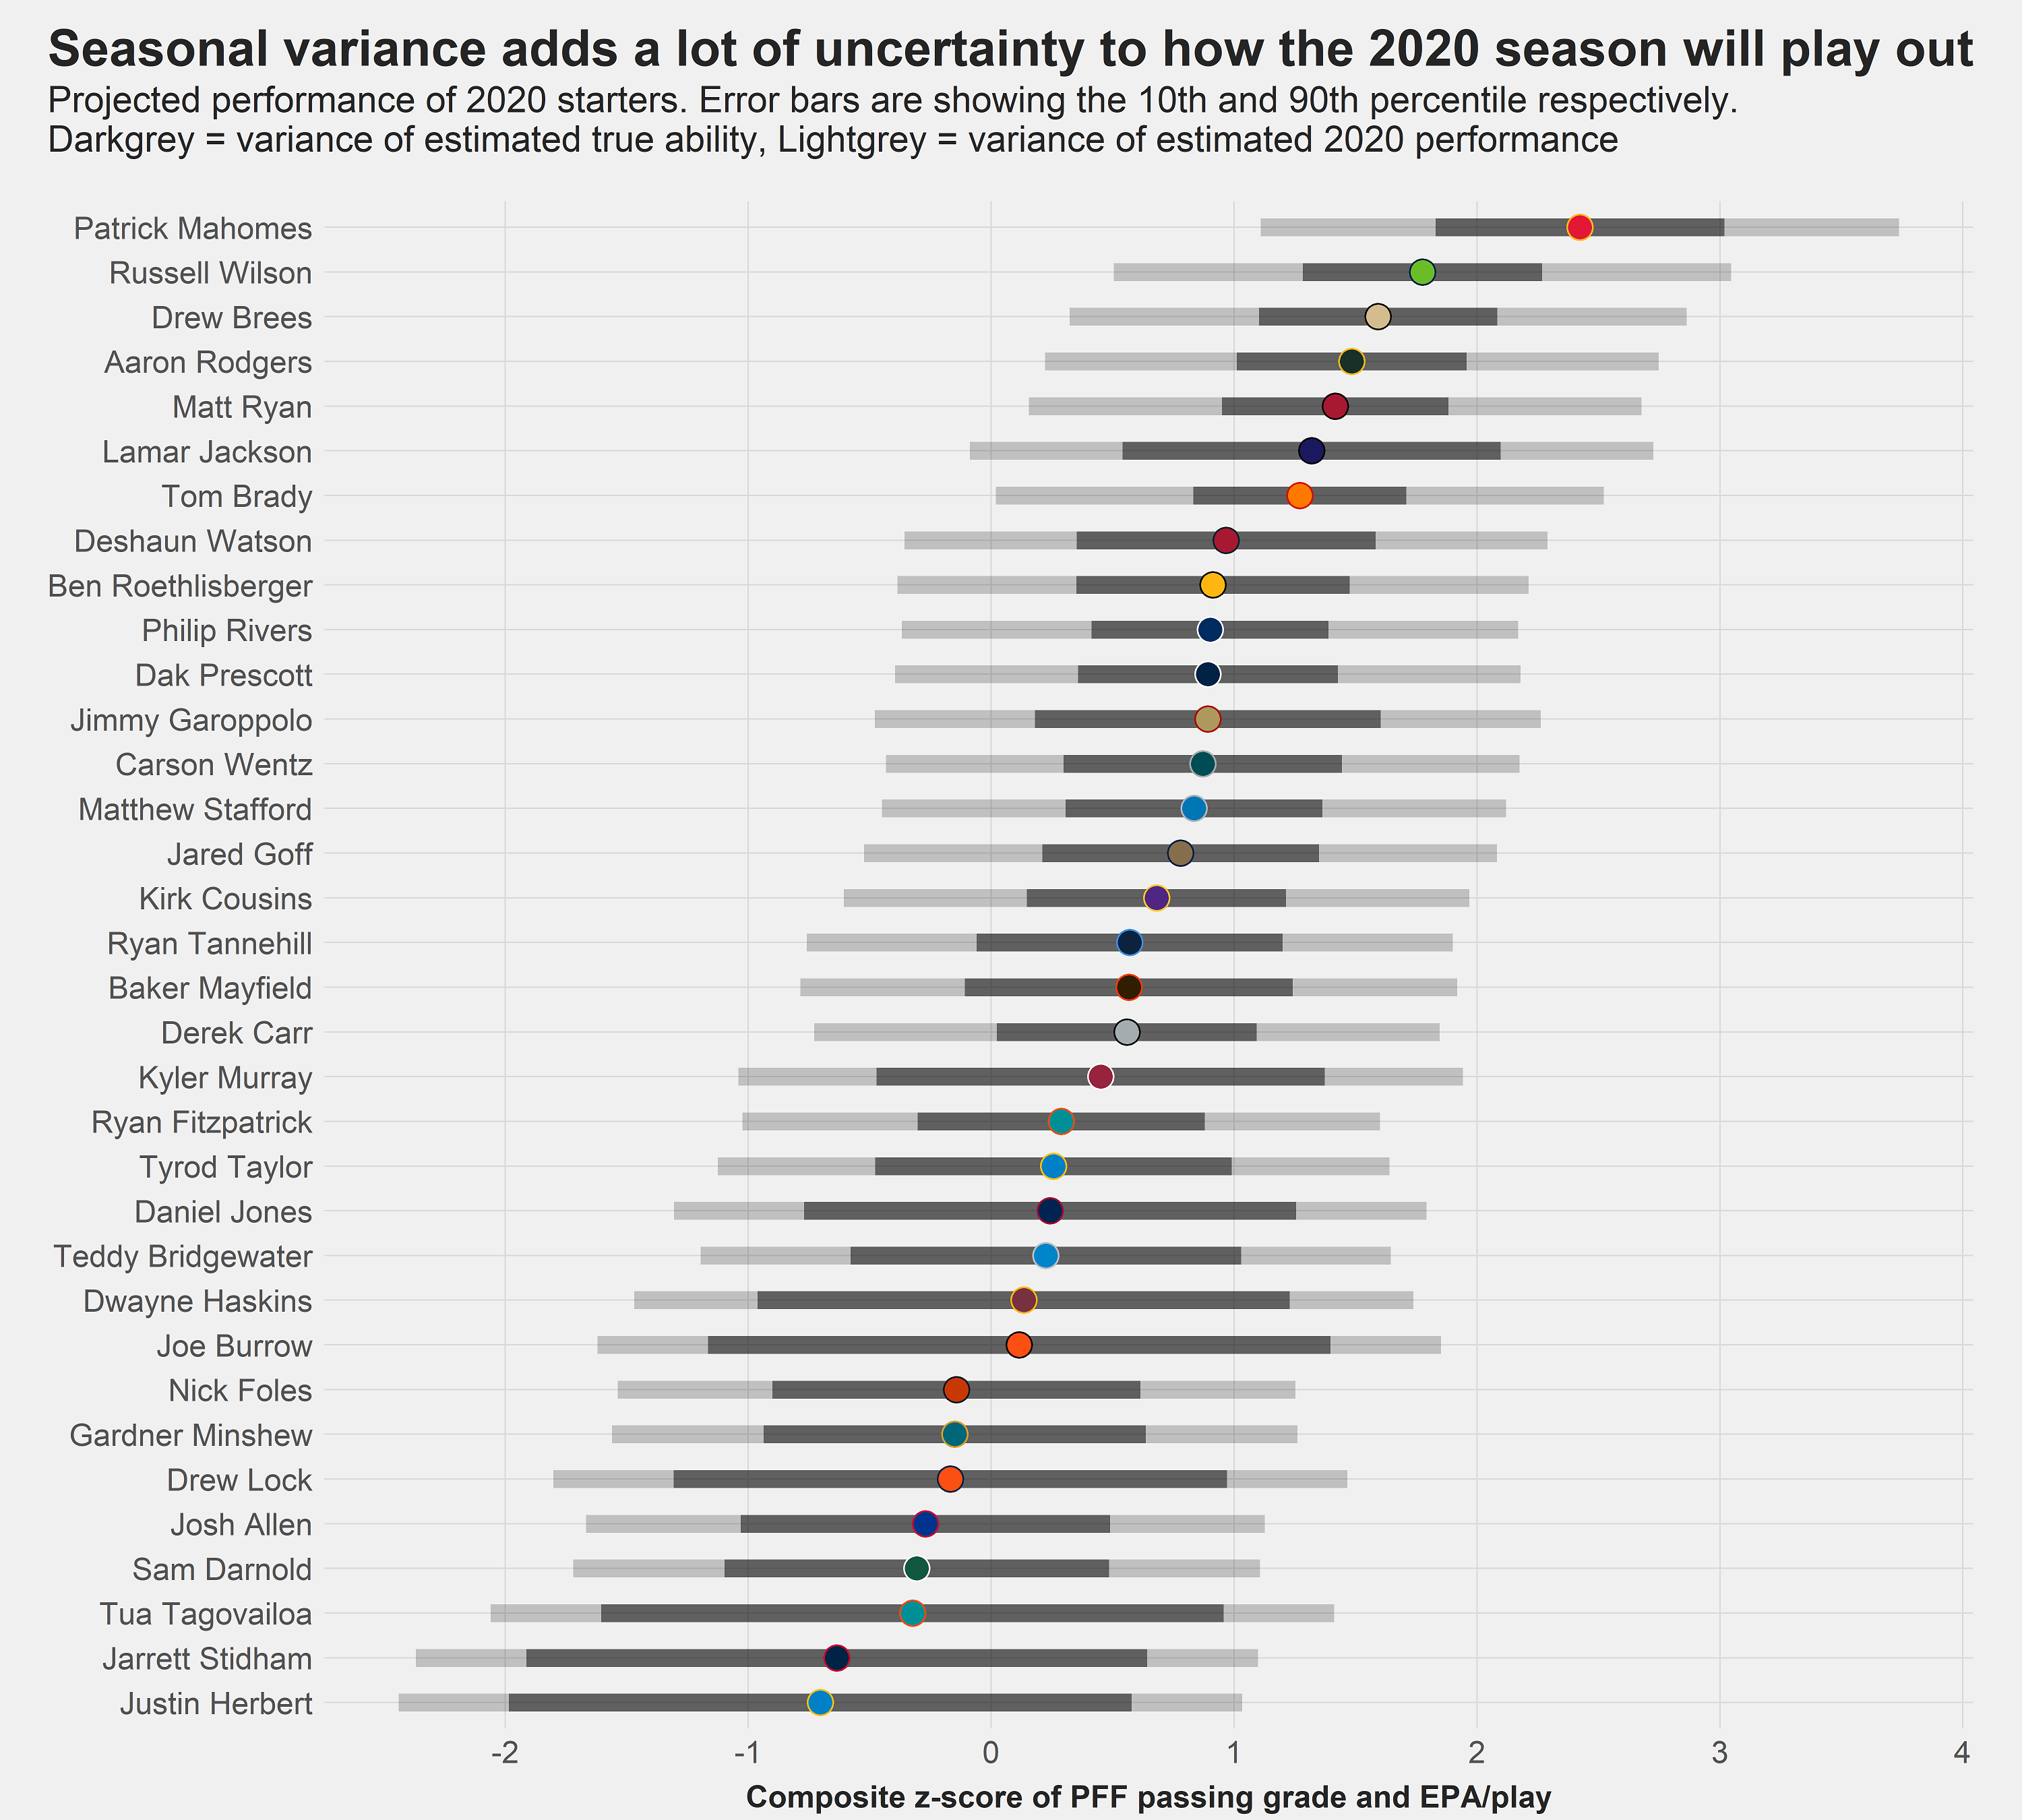
The following chart visualizes the results and shows the point estimates as well as the variance that comes with it. It shows the 10th and 90th percentile of the estimated true ability of each quarterback and the estimated 2020 performance.
There are several takeaways:
- Patrick Mahomes is currently a unicorn in our data. We’ve seen this kind of dominance once before in the PFF era: It was when Peyton Manning led all quarterbacks with an even greater margin after the conclusion of the 2009 season when he ranked 0.7 standard deviations above the second- and third-ranked quarterbacks (Drew Brees and Philip Rivers). With Tom Brady starting his unprecedented run in the second half of his career as well as Aaron Rodgers’ emergence, Manning couldn’t hold such a huge lead for long and had to concede the top spot to Rodgers after the 2011 season. It will be interesting to see who will step up and make a push towards ending Mahomes’ dominance.
- For experienced veterans, the variance stems mostly from single-season variance. For young quarterbacks — and especially rookies — a large part of the variance comes from our uncertainty about the true skill as an NFL quarterback.
- All confidence intervals overlap. Mahomes’ 10th percentile and Justin Herbert’s (the last-ranked starter) 90th percentile are roughly the same. It is theoretically possible that Herbert has a better season than Mahomes in the AFC West, even though the chance is only 1%.
Conclusion
Using a blend of PFF passing grade and EPA per play, we’ve established a thorough method of ranking quarterbacks based on what they’ve shown us in their career and, most importantly, what they’ve shown us in recent years. We found Patrick Mahomes, Russell Wilson and Drew Brees are the top three quarterbacks going into 2020.
Additionally, we are also able to give distributions for each quarterback, both estimating the uncertainty in true ability and the 2020 performance. We found that single-season performance comes with a lot more uncertainty and that even seasoned veterans can deviate a lot from the expectation. This is, after all, one of the reasons why football is the sport we love.