The NFL Combine has come and gone, leaving in its wake a wave of winners, losers and shifting big boards. Not to be left out of the fun, I dove in with an analytical look at the 2020 prospects based on which Combine metrics matter for offensive and defensive players.
The technique I used in those analyses is called ridge regression, which is great at quantifying the importance of each metric for comparison. We can now say with some confidence which drills matter most for each position group based on historical data. In this analysis, my process changes in a few ways.
First, the target variable, i.e. what we’re predicting, is going to be the fantasy football success of prospects, not draft position and player value (PFF WAR). Second, fantasy success is measured as a binary variable (yes/no), based on whether each player achieved a particular season-end scoring threshold in his first three seasons. These thresholds are top-12 scorer for quarterbacks, top-20 for running backs, top-30 for wide receivers and top-eight for tight ends. Lastly, the algorithm employed here doesn’t assume there is the linear relationship between performance in each feature variable and the target, and there’s no assumption that features are independent.
[Editor's Note: PFF's new college-to-pro projection system is powered by AWS machine learning capabilities.]
This analysis projects the likelihood of fantasy success in a prospect's first three seasons using the random forest algorithm. Random forest predicts classifications (success or not) by building many decision trees, randomizing samples and features, creating a “forest” of decision trees whose collective predictions are more accurate than an individual tree.
This technique differs from the more linear relationships in classification algorithms like logistic regression. A linear relationship would tell us that a prospect who runs 0.2 seconds faster than average would have a feature effect twice that as one who runs 0.1 seconds faster, but we know that relationships aren’t that simple and the benefits of being faster, bigger, quicker can see diminishing returns as some point. The downside of using random forest versus logistic regression comes in interpretability. While forest-based algorithms often produce better predictions, the exact manner in which they have split data and assigned probabilities is opaque.
I’ll illustrate the process below for every position by including an example decision tree first, then detailing results of the random forest predictions on historical prospects and the 2020 class. You’ll see that a single decision tree contains some useful insights but with rigid cutoffs that are likely overfit to past data.
Quarterbacks
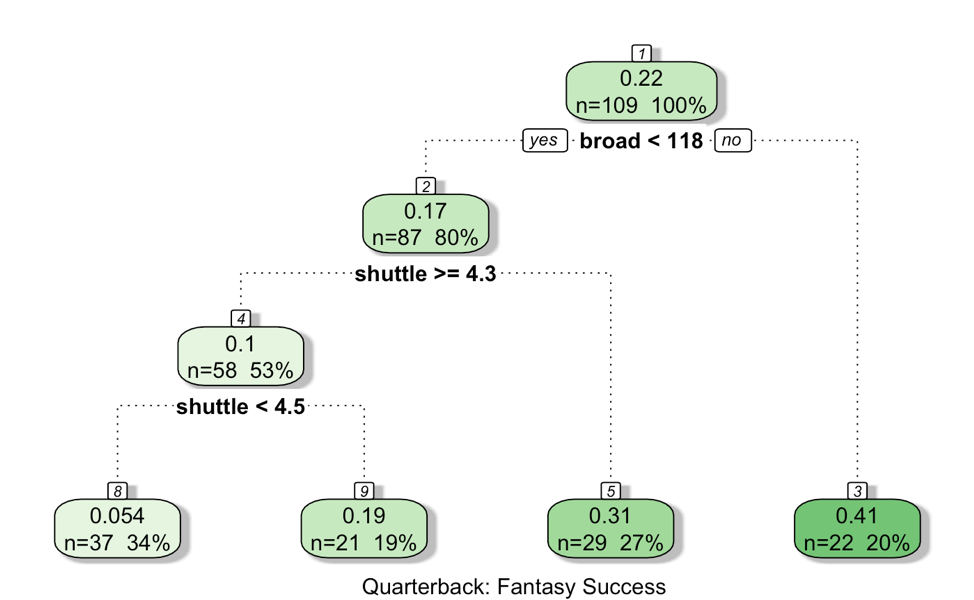
Our sample decision for the quarterback tree includes the 110 prospects in our 2007-2017 data who participated in the majority of Combine drills. The first split is by broad jump at 118 inches, with those at or above this number falling into the highest success node. This is the node in the lower right corner, that includes three numbers: the ratio of data points that fall into the node classified as successful (0.41), the total number of prospects who fall into the node (n=22) and the rough percentage that fall into the node of the entire population (20%).
Those who don’t make the 118-inch cut for broad jump are then sorted by short shuttle times, first at less than 4.3 seconds and then greater than or equal to 4.5 seconds. This is a perfect example of how using a single decision tree can overfit the data. There’s no logical reason why a quarterback would be more successful with a short shuttle at or above 4.5 seconds than at 4.4 seconds, which is the case for the last split in the bottom left. The random forest we use for the results below is informed by so many trees that overfitting is less of an issue.
Top-10 Historical Success Probabilities: Quarterbacks (2006-2017)
| Year | Pick | Player | Success | Success Prob | Height | Weight | Forty | Bench | Broad | Vertical | 3cone | Shuttle |
| 2014 | 3 | Blake Bortles | Yes | 62.6% | 77 | 232 | 4.93 | NaN | 115 | 32.5 | 7.08 | 4.21 |
| 2016 | 26 | Paxton Lynch | No | 60.0% | 79 | 244 | 4.86 | NaN | 118 | 36 | 7.14 | 4.26 |
| 2010 | 25 | Tim Tebow | No | 59.9% | 75 | 236 | 4.71 | NaN | 115 | 38.5 | 6.66 | 4.17 |
| 2009 | 17 | Josh Freeman | Yes | 58.1% | 78 | 248 | 4.9 | NaN | 119 | 33.5 | 7.11 | 4.43 |
| 2017 | 300 | Mitch Leidner | No | 56.4% | 75 | 226 | 4.93 | NaN | 123 | 34.5 | 6.96 | 4.25 |
| 2009 | 5 | Mark Sanchez | Yes | 56.3% | 74 | 227 | 4.93 | NaN | 116 | 32.5 | 7.06 | 4.21 |
| 2015 | 103 | Bryce Petty | No | 55.2% | 75 | 230 | 4.87 | NaN | 121 | 34 | 6.91 | 4.13 |
| 2016 | 135 | Dak Prescott | Yes | 54.3% | 74 | 226 | 4.79 | NaN | 116 | 32.5 | 7.11 | 4.32 |
| 2017 | 2 | Mitchell Trubisky | No | 50.7% | 74 | 222 | 4.67 | NaN | 116 | 27.5 | 6.87 | 4.25 |
| 2011 | 300 | Jerrod Johnson | No | 49.3% | 77 | 251 | 4.75 | NaN | 119 | 29 | 7.28 | 4.31 |
As I mentioned earlier, it’s more difficult to interpret random forest results, but the consistent themes in the top-10 are strong broad jumps and middling-to-strong performance in the agility drills. In addition, all 40-yard dash times were under five seconds, and all weights are over 220 pounds.
The model was fairly poor at picking out actual success, with only fleeting successes like Blake Bortles, Josh Freeman and Mark Sanchez qualifying. The results tell us what we already knew: a lot more goes into being a successful quarterback than athleticism.
2020 Quarterbacks
| Year | Player | Success Prob | Height | Weight | Forty | Bench | Broad | Vertical | 3cone | Shuttle | Rank |
| 2020 | Justin Herbert | 50.0% | 78 | 236 | 4.68 | NaN | 123 | 35.5 | 7.06 | 4.46 | 10 |
| 2020 | Cole McDonald | 42.5% | 75 | 215 | 4.58 | NaN | 121 | 36.0 | 7.13 | 4.52 | 21 |
| 2020 | James Morgan | 34.5% | 76 | 229 | 4.89 | NaN | 112 | 29.0 | 7.51 | 4.64 | 40 |
| 2020 | Nate Stanley | 33.1% | 75 | 235 | 4.81 | NaN | 108 | 28.5 | 7.26 | 4.48 | 42 |
| 2020 | Jalen Hurts | 31.5% | 73 | 222 | 4.59 | NaN | 125 | 35.0 | NaN | NaN | 44 |
| 2020 | Jake Fromm | 30.2% | 73 | 219 | 5.01 | NaN | 111 | 30.0 | 7.27 | 4.51 | 48 |
| 2020 | Kelly Bryant | 27.3% | 75 | 229 | 4.69 | NaN | 125 | 35.0 | 7.33 | 4.51 | 56 |
| 2020 | Kevin Davidson | 26.5% | 76 | 224 | 5.00 | NaN | NaN | NaN | 7.13 | 4.37 | 61 |
| 2020 | Jordan Love | 20.0% | 75 | 224 | 4.74 | NaN | 118 | 35.5 | 7.21 | 4.52 | 83 |
| 2020 | Jacob Eason | 19.6% | 77 | 231 | 4.89 | NaN | 110 | 27.5 | 7.50 | 4.75 | 84 |
| 2020 | Shea Patterson | 18.7% | 72 | 212 | 4.71 | NaN | 116 | 31.0 | 7.14 | 4.50 | 91 |
| 2020 | Steven Montez | 7.3% | 76 | 231 | 4.68 | NaN | 117 | 33.0 | 7.25 | 4.43 | 144 |
| 2020 | Brian Lewerke | 7.2% | 74 | 213 | 4.95 | NaN | NaN | NaN | 7.14 | 4.40 | 145 |
Justin Herbert checks all the Combine boxes as a tall, big, relatively fast and quick quarterback. Even then, the model only gives him a coin-flip chance at success based only on measurables. Jalen Hurts is shockingly fifth in the 2020 class, though he’s likely penalized significantly for skipping the agility drills despite his top-level speed and jumps.
Running Backs
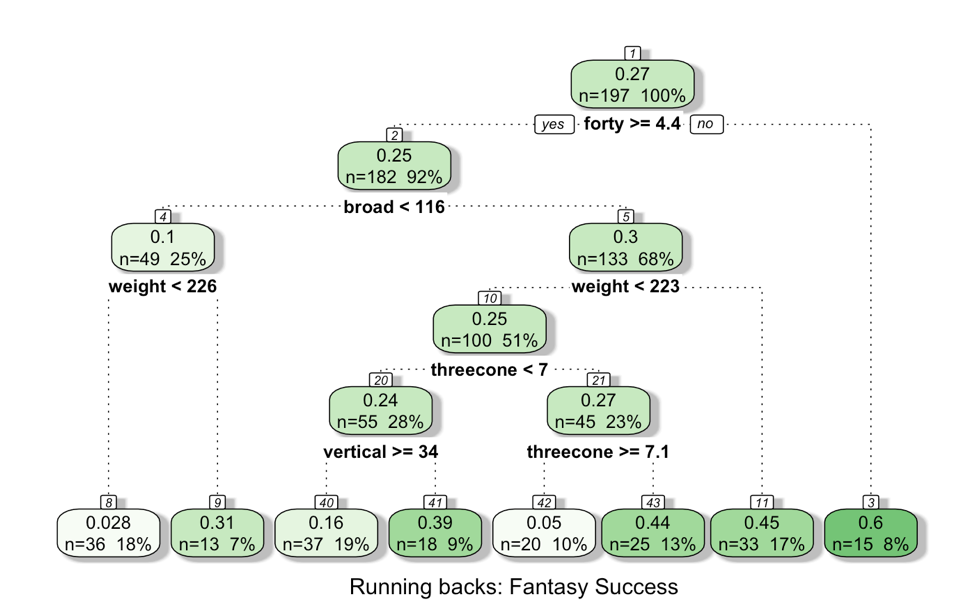
The sample decision tree for running backs is more complex, mostly due to the larger sample of players at the position who participate at the combine in comparison to quarterbacks. It’s also the case that athleticism matters more for running backs, with the top three leafs (final nodes) of the tree with average success rates between 0.44 and 0.6. The first (most important) split is at 4.4 seconds in the 40-yard dash, with players below that mark finding fantasy success 60% of the time. Next, the broad jump, weight, three-cone drill and vertical jump all factor into various splits. Again, some of the splits directionally go against intuition, but that’s why we build a forest of decision trees for our final numbers below.
Top-10 Historical Success Probabilities: Running Backs (2006-2017)
| Year | Pick | Player | Success | Success Prob | Height | Weight | Forty | Bench | Broad | Vertical | 3cone | Shuttle |
| 2007 | 7 | Adrian Peterson | Yes | 77.5% | 73 | 217 | 4.40 | NaN | 127 | 38.5 | 7.09 | 4.40 |
| 2008 | 73 | Jamaal Charles | Yes | 76.1% | 71 | 200 | 4.38 | NaN | 122 | 30.5 | 6.80 | 4.22 |
| 2016 | 73 | Kenyan Drake | Yes | 74.9% | 73 | 210 | 4.45 | 10 | 123 | 34.5 | 7.04 | 4.21 |
| 2008 | 55 | Ray Rice | Yes | 73.6% | 68 | 199 | 4.42 | 23 | 119 | 31.5 | 6.65 | 4.20 |
| 2017 | 8 | Christian McCaffrey | Yes | 73.3% | 71 | 202 | 4.48 | 10 | 121 | 37.5 | 6.57 | 4.22 |
| 2008 | 44 | Matt Forte | Yes | 72.5% | 73 | 217 | 4.44 | 23 | 118 | 33.0 | 6.84 | 4.23 |
| 2006 | 30 | Joseph Addai | Yes | 71.8% | 71 | 214 | 4.40 | 18 | 125 | 38.5 | 7.09 | 4.47 |
| 2013 | 48 | Le'Veon Bell | Yes | 71.8% | 73 | 230 | 4.60 | 24 | 118 | 31.5 | 6.75 | 4.24 |
| 2011 | 73 | Stevan Ridley | Yes | 70.0% | 71 | 225 | 4.65 | 18 | 118 | 36.0 | 6.78 | 4.21 |
| 2016 | 45 | Derrick Henry | Yes | 69.8% | 75 | 247 | 4.54 | 22 | 130 | 37.0 | 7.20 | 4.38 |
The random forest model is much more accurate at running back, with all of the top-10 in success probability being actual successes in the NFL. Some of this is the fact that the model was fit on the same data that it is now predicting, but it’s also due to the strength of athleticism in predicting positional success. The tenth-highest predicted probability for running backs (Derrick Henry, 69.8%) is higher than the top probability at quarterback.
2020 Running Backs
| Year | Player | Success Prob | Height | Weight | Forty | Bench | Broad | Vertical | 3cone | Shuttle |
| 2020 | Jonathan Taylor | 45.8% | 70 | 226 | 4.39 | 17 | 123 | 36.0 | 7.01 | 4.24 |
| 2020 | AJ Dillon | 37.6% | 72 | 247 | 4.53 | 23 | 131 | 41.0 | 7.19 | NaN |
| 2020 | Brian Herrian | 33.8% | 71 | 209 | 4.62 | 18 | 126 | 38.5 | 7.12 | 4.40 |
| 2020 | Darius Anderson | 32.2% | 70 | 208 | 4.61 | 19 | 128 | 36.0 | NaN | 4.19 |
| 2020 | Cam Akers | 29.6% | 70 | 217 | 4.47 | 20 | 122 | 35.5 | NaN | 4.42 |
| 2020 | JaMycal Hasty | 29.4% | 68 | 205 | 4.55 | 15 | 123 | 39.0 | NaN | 4.03 |
| 2020 | Anthony McFarland | 26.9% | 68 | 208 | 4.44 | NaN | 116 | 29.5 | NaN | NaN |
| 2020 | Darrynton Evans | 25.4% | 70 | 203 | 4.41 | 20 | 125 | 37.0 | NaN | NaN |
| 2020 | Rico Dowdle | 24.0% | 71 | 213 | 4.54 | NaN | 127 | 38.0 | NaN | NaN |
| 2020 | James Robinson | 22.4% | 69 | 219 | 4.64 | 24 | 125 | 40.0 | 7.03 | 4.19 |
| 2020 | Scottie Phillips | 21.7% | 68 | 209 | 4.56 | 29 | 114 | 30.0 | 7.40 | 4.53 |
| 2020 | Joshua Kelley | 20.0% | 70 | 212 | 4.49 | 23 | 121 | 31.0 | 6.95 | 4.28 |
| 2020 | Raymond Calais | 19.6% | 67 | 188 | 4.42 | 20 | 120 | 37.5 | NaN | NaN |
| 2020 | Eno Benjamin | 19.0% | 68 | 207 | 4.57 | 12 | 122 | 39.0 | 6.97 | 4.25 |
| 2020 | Javon Leake | 17.8% | 72 | 215 | 4.65 | NaN | 125 | 28.5 | NaN | NaN |
| 2020 | LeVante Bellamy | 16.9% | 68 | 192 | 4.50 | 16 | 125 | 39.5 | NaN | NaN |
| 2020 | Clyde Edwards-Helaire | 16.9% | 67 | 207 | 4.60 | 15 | 123 | 39.5 | NaN | NaN |
| 2020 | Patrick Taylor | 16.5% | 73 | 217 | 4.57 | 15 | 123 | 34.0 | NaN | 4.34 |
| 2020 | Tony Jones Jr. | 14.6% | 70 | 220 | 4.68 | 13 | 119 | 32.5 | 7.18 | 4.21 |
| 2020 | Sewo Olonilua | 13.8% | 74 | 232 | 4.66 | 25 | 123 | 36.0 | NaN | 4.28 |
| 2020 | D'Andre Swift | 12.7% | 68 | 212 | 4.48 | NaN | 121 | 35.5 | NaN | NaN |
| 2020 | J.J. Taylor | 12.6% | 65 | 185 | 4.61 | 19 | 118 | 34.5 | 7.00 | 4.15 |
| 2020 | Ke'Shawn Vaughn | 9.7% | 69 | 214 | 4.51 | NaN | 117 | 32.0 | NaN | NaN |
| 2020 | DeeJay Dallas | 6.6% | 70 | 217 | 4.58 | NaN | 119 | 33.5 | 7.18 | 4.32 |
| 2020 | Salvon Ahmed | 4.1% | 70 | 197 | 4.62 | NaN | 120 | 34.5 | NaN | NaN |
| 2020 | Benny LeMay | 3.8% | 68 | 221 | 4.75 | 24 | 112 | 34.0 | NaN | NaN |
| 2020 | Lamical Perine | 3.7% | 70 | 216 | 4.62 | 22 | 118 | 35.0 | 7.13 | 4.31 |
| 2020 | Zack Moss | 1.6% | 69 | 223 | 4.65 | 19 | NaN | 33.0 | NaN | 4.37 |
Jonathan Taylor performs best in the fantasy success model, though at 45.8% probability perhaps not as well as you would have suspected. A.J. Dillon isn’t far behind in the class, while PFF’s pre-Combine RB1, Zack Moss, was given the lowest probability of success by the model at a paltry 1.6%.
Wide Receivers
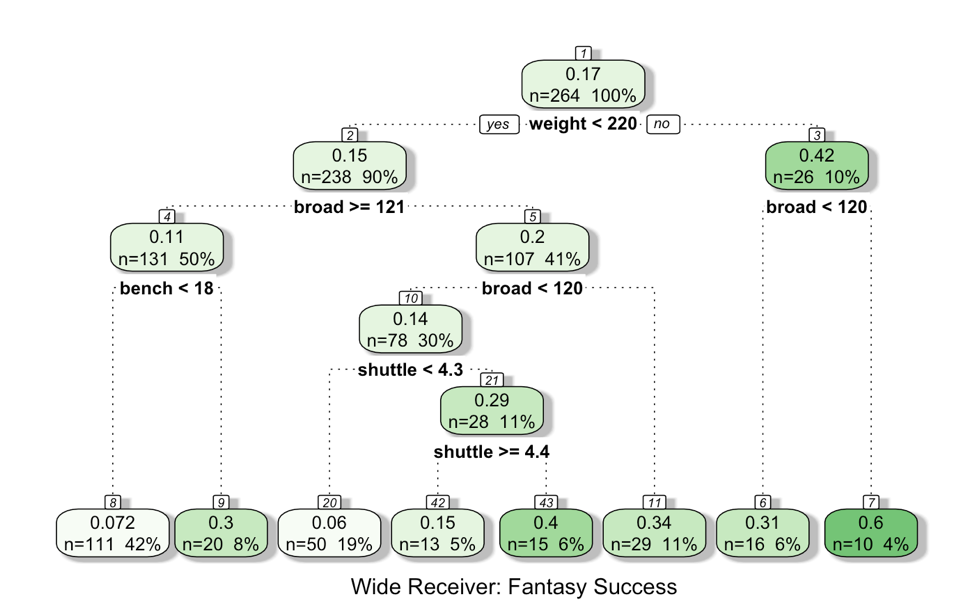
The sample tree for wide receivers splits first at weight (200 pounds), then broad jump (120-121 inches), and for lower leaves short shuttle and bench press. Looking back to the 2006-2017 sample could be overvaluing receiver size, as it’s become less of a driver in today’s space-seeking NFL offenses. Still, the big prototype WR1s are probably the best bets to attract targets and see fantasy success early in their careers.
Top-10 Historical Success Probabilities: Wide Receivers (2006-2017)
| Year | Pick | Player | Success | Success Prob | Height | Weight | Forty | Bench | Broad | Vertical | 3cone | Shuttle |
| 2018 | 91 | Trequan Smith | No | 62.2% | 74 | 203 | 4.49 | 12 | 130 | 37.5 | 6.97 | 4.50 |
| 2018 | 174 | Marquez Valdes-Scantling | No | 56.6% | 76 | 206 | 4.37 | 15 | 124 | 30.5 | NaN | NaN |
| 2012 | 43 | Stephen Hill | No | 52.8% | 76 | 215 | 4.36 | 14 | 133 | 39.5 | 6.88 | 4.48 |
| 2014 | 90 | Donte Moncrief | No | 51.2% | 74 | 221 | 4.40 | 13 | 132 | 39.5 | 7.02 | 4.30 |
| 2007 | 2 | Calvin Johnson | Yes | 48.8% | 77 | 239 | 4.35 | NaN | NaN | NaN | NaN | NaN |
| 2013 | 34 | Justin Hunter | No | 45.8% | 76 | 196 | 4.44 | NaN | 136 | 39.5 | NaN | 4.33 |
| 2015 | 7 | Kevin White | No | 44.2% | 75 | 215 | 4.35 | 23 | 123 | 36.5 | 6.92 | 4.14 |
| 2008 | 84 | Harry Douglas | No | 42.7% | 71 | 176 | 4.51 | NaN | 120 | 31.0 | 6.57 | 4.12 |
| 2007 | 157 | David Clowney | No | 42.5% | 72 | 188 | 4.36 | NaN | 123 | 32.5 | 7.00 | 4.15 |
| 2009 | 124 | Louis Murphy | No | 41.8% | 74 | 203 | 4.32 | 12 | NaN | NaN | NaN | NaN |
The wide receiver success model was fairly awful at finding successful wide receivers, only hitting on Calvin Johnson. The other athletic marvels on the top-10 list weren’t able to translate those gifts into fantasy production, another sign that we shouldn't read too much into wide receiver results from the Combine.
2020 Wide Receivers
| Year | Player | Success Prob | Height | Weight | Forty | Bench | Broad | Vertical | 3cone | Shuttle |
| 2020 | Denzel Mims | 46.3% | 74 | 207 | 4.38 | 16 | 131 | 38.5 | 6.66 | 4.43 |
| 2020 | Chase Claypool | 44.1% | 76 | 238 | 4.42 | 19 | 126 | 40.5 | NaN | NaN |
| 2020 | Isaiah Hodgins | 39.2% | 75 | 210 | 4.61 | 9 | 124 | 36.5 | 7.01 | 4.12 |
| 2020 | Michael Pittman Jr. | 36.8% | 76 | 223 | 4.52 | 13 | 121 | 36.5 | 6.96 | 4.14 |
| 2020 | Dezmon Patmon | 29.9% | 75 | 225 | 4.48 | 15 | 132 | 36.0 | 7.28 | 4.38 |
| 2020 | Juwan Johnson | 29.3% | 76 | 230 | 4.58 | 14 | 124 | 33.0 | 6.94 | 4.37 |
| 2020 | Brandon Aiyuk | 28.6% | 71 | 205 | 4.50 | 11 | 128 | 40.0 | NaN | NaN |
| 2020 | Jalen Reagor | 26.5% | 70 | 206 | 4.47 | 17 | 138 | 42.0 | 7.31 | 4.46 |
| 2020 | Tyrie Cleveland | 23.1% | 74 | 209 | 4.46 | 13 | 126 | 39.5 | NaN | NaN |
| 2020 | Jerry Jeudy | 22.4% | 73 | 193 | 4.45 | NaN | 120 | 35.0 | NaN | 4.53 |
| 2020 | Henry Ruggs III | 22.3% | 71 | 188 | 4.27 | NaN | 131 | 42.0 | NaN | NaN |
| 2020 | Antonio Gandy-Golden | 21.9% | 76 | 223 | 4.60 | 22 | 127 | 36.0 | 7.33 | 4.55 |
| 2020 | Quez Watkins | 21.3% | 72 | 185 | 4.35 | NaN | 125 | 36.5 | 7.28 | 4.36 |
| 2020 | Darnell Mooney | 20.6% | 70 | 176 | 4.38 | 9 | 124 | 37.0 | NaN | NaN |
| 2020 | Isaiah Coulter | 19.6% | 73 | 198 | 4.45 | NaN | 121 | 36.0 | 7.28 | 4.62 |
| 2020 | Donovan Peoples-Jones | 19.2% | 73 | 212 | 4.48 | NaN | 139 | 44.5 | NaN | NaN |
| 2020 | Devin Duvernay | 19.1% | 70 | 200 | 4.39 | NaN | 123 | 35.5 | 7.13 | 4.20 |
| 2020 | Gabriel Davis | 16.8% | 74 | 216 | 4.54 | 14 | 124 | 35.0 | 7.08 | 4.59 |
| 2020 | Justin Jefferson | 15.9% | 73 | 202 | 4.43 | NaN | 126 | 37.5 | NaN | NaN |
| 2020 | Antonio Gibson | 15.7% | 72 | 228 | 4.39 | 16 | 118 | 35.0 | NaN | NaN |
| 2020 | Kalija Lipscomb | 14.7% | 71 | 207 | 4.57 | 16 | 127 | 32.0 | NaN | NaN |
| 2020 | K.J. Osborn | 14.7% | 71 | 203 | 4.48 | 18 | 123 | 37.5 | 7.00 | 4.35 |
| 2020 | Kendrick Rogers | 13.8% | 76 | 208 | 4.51 | 17 | 124 | 35.5 | 7.13 | 4.48 |
| 2020 | Chris Finke | 13.4% | 69 | 186 | 4.57 | 7 | NaN | 40.0 | NaN | NaN |
| 2020 | Binjimen Victor | 11.5% | 75 | 198 | 4.60 | 9 | 128 | 35.0 | 7.10 | NaN |
| 2020 | Jeff Thomas | 10.7% | 68 | 170 | 4.45 | NaN | 125 | 36.5 | NaN | NaN |
| 2020 | Stephen Guidry | 10.6% | 75 | 201 | 4.47 | NaN | 125 | 34.0 | 7.31 | 4.46 |
| 2020 | Omar Bayless | 10.6% | 72 | 212 | 4.62 | 11 | 123 | 36.0 | 7.35 | 4.50 |
| 2020 | Joe Reed | 10.5% | 72 | 224 | 4.47 | 21 | 123 | 38.0 | NaN | NaN |
| 2020 | Trishton Jackson | 9.9% | 72 | 197 | 4.50 | NaN | 117 | 36.0 | NaN | NaN |
| 2020 | Marquez Callaway | 9.8% | 73 | 205 | 4.55 | NaN | 126 | 38.0 | NaN | NaN |
| 2020 | Jauan Jennings | 9.6% | 75 | 215 | 4.72 | NaN | 119 | 29.0 | NaN | NaN |
| 2020 | Cody White | 8.8% | 75 | 217 | 4.66 | NaN | 120 | 35.5 | 7.19 | 4.52 |
| 2020 | Malcolm Perry | 8.5% | 69 | 186 | 4.63 | 10 | 122 | 36.0 | 7.12 | 4.31 |
| 2020 | CeeDee Lamb | 8.5% | 73 | 198 | 4.50 | 11 | 124 | 34.5 | NaN | NaN |
| 2020 | Aaron Parker | 8.0% | 73 | 209 | 4.57 | 12 | 112 | 26.5 | 6.94 | 4.23 |
| 2020 | Tony Brown | 6.9% | 72 | 198 | 4.65 | 14 | 119 | 33.5 | 7.21 | 4.27 |
| 2020 | Quintez Cephus | 5.7% | 72 | 202 | 4.73 | 23 | 124 | 38.5 | 7.20 | 4.33 |
| 2020 | Freddie Swain | 5.5% | 72 | 197 | 4.46 | 16 | 124 | 36.5 | 7.05 | 4.26 |
| 2020 | John Hightower | 5.5% | 73 | 189 | 4.43 | NaN | 122 | 38.5 | 7.07 | 4.21 |
| 2020 | Aaron Fuller | 3.9% | 70 | 188 | 4.59 | NaN | 118 | 34.0 | 7.14 | NaN |
| 2020 | Quartney Davis | 3.0% | 73 | 201 | 4.54 | NaN | NaN | 35.5 | NaN | NaN |
| 2020 | Laviska Shenault Jr. | 2.7% | 72 | 227 | 4.58 | 17 | NaN | NaN | NaN | NaN |
| 2020 | Austin Mack | 2.4% | 73 | 208 | 4.59 | NaN | 117 | 31.5 | NaN | 4.42 |
| 2020 | K.J. Hill | 0.8% | 71 | 196 | 4.60 | 17 | 114 | 32.5 | NaN | NaN |
Buzz is building post-Combine for names at the top of the list like Denzel Mims and Chase Claypool, but the wide receiver model still sees them at less than 50% for fantasy success. I’m not suggesting that you ignore the results of the Combine, as they’ll at least affect draft positions. But caution is probably in order before thinking about adding them to dynasty rosters ahead of more accomplished receivers.
Tight Ends
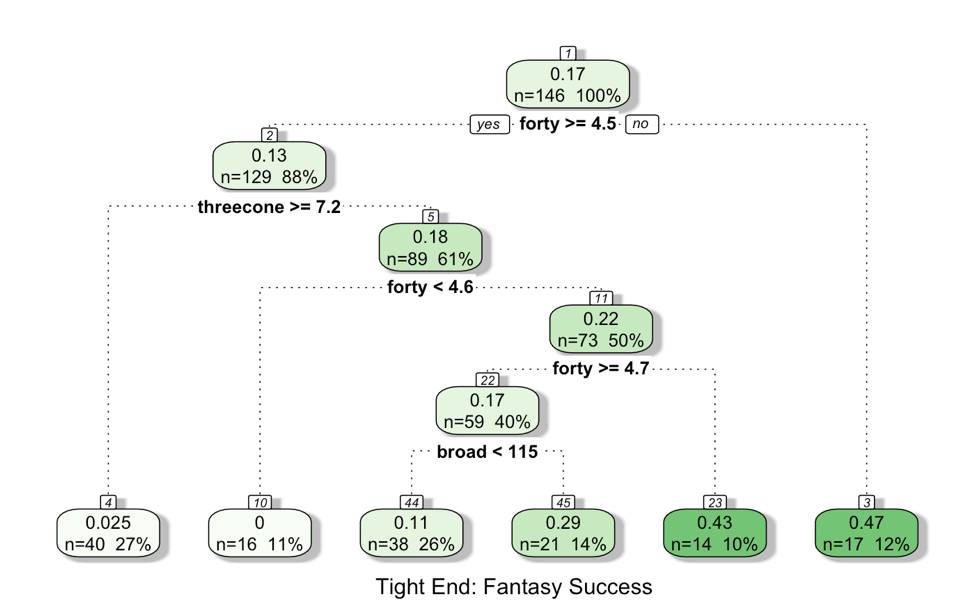
The sample decision tree for tight ends first splits at 40-yard dash (4.5 seconds), then for the tight ends who don’t make that steep threshold at three-cone drill (7.2 seconds), and broad jump. In fantasy football, we don’t care much about tight-end versatility or how well they block, but the ability to stretch the field and get open with quickness are paramount.
Top-10 Historical Success Probabilities: Wide Receivers (2006-2017)
| Year | Pick | Player | Success | Success Prob | Height | Weight | Forty | Bench | Broad | Vertical | 3cone | Shuttle |
| 2017 | 19 | O.J. Howard | No | 58.9% | 78 | 251 | 4.51 | 22 | 121 | 30.0 | 6.85 | 4.16 |
| 2008 | 141 | Gary Barnidge | No | 50.4% | 78 | 243 | 4.61 | 22 | 117 | 31.0 | 6.92 | 4.23 |
| 2015 | 204 | Darren Waller | No | 46.9% | 78 | 238 | 4.46 | 12 | 125 | 37.0 | 7.07 | 4.25 |
| 2013 | 222 | Chris Gragg | No | 43.4% | 75 | 244 | 4.50 | 18 | 125 | 37.5 | 7.08 | 4.51 |
| 2012 | 34 | Coby Fleener | No | 42.7% | 78 | 247 | 4.51 | 27 | NaN | NaN | NaN | NaN |
| 2007 | 31 | Greg Olsen | No | 40.8% | 78 | 254 | 4.51 | 23 | 114 | 35.5 | 7.04 | 4.48 |
| 2006 | 72 | Leonard Pope | No | 39.0% | 80 | 258 | 4.62 | 22 | 118 | 37.5 | 7.47 | 4.67 |
| 2008 | 300 | Darrell Strong | No | 38.9% | 76 | 268 | 4.78 | 17 | 110 | 25.0 | 6.86 | 4.36 |
| 2008 | 158 | Kellen Davis | No | 38.2% | 78 | 262 | 4.59 | 22 | 118 | 28.0 | 7.25 | 4.38 |
| 2015 | 117 | Blake Bell | No | 36.7% | 78 | 252 | 4.8 | 14 | 116 | 33.0 | 6.85 | 4.32 |
The threshold of fantasy success for tight ends in this analysis is tougher at TE8, but the model going 0-for-10 isn’t a great endorsement. It has identified move tight ends, some of whom were eventually successes later in their careers, like Greg Olsen and Darren Waller. If anything, the model’s lack of accuracy points to some of the randomness of the position and how closely it’s linked to quarterback and touchdown scoring.
2020 Tight Ends
| Year | Player | Success Prob | Height | Weight | Forty | Bench | Broad | Vertical | 3cone | Shuttle |
| 2020 | Adam Trautman | 37.6% | 77 | 255 | 4.80 | 18 | 114 | 34.5 | 6.78 | 4.27 |
| 2020 | Albert Okwuegbunam | 35.7% | 77 | 258 | 4.49 | NaN | NaN | NaN | NaN | NaN |
| 2020 | Dalton Keene | 23.9% | 76 | 253 | 4.71 | 21 | 125 | 34.0 | 7.07 | 4.19 |
| 2020 | Stephen Sullivan | 22.9% | 76 | 248 | 4.66 | NaN | 123 | 36.5 | 7.51 | 4.62 |
| 2020 | Charlie Taumoepeau | 22.5% | 74 | 240 | 4.75 | 18 | 121 | 36.5 | 7.00 | 4.27 |
| 2020 | Charlie Woerner | 15.1% | 76 | 244 | 4.78 | 21 | 120 | 34.5 | 7.18 | 4.46 |
| 2020 | Josiah Deguara | 14.0% | 74 | 242 | 4.72 | 25 | 115 | 35.5 | 7.15 | 4.35 |
| 2020 | C.J. O'Grady | 13.8% | 75 | 253 | 4.81 | 16 | 119 | 34.0 | 7.30 | 4.34 |
| 2020 | Devin Asiasi | 13.7% | 75 | 257 | 4.73 | 16 | 115 | 30.5 | NaN | NaN |
| 2020 | Cole Kmet | 13.2% | 77 | 262 | 4.70 | NaN | 123 | 37.0 | 7.44 | 4.41 |
| 2020 | Colby Parkinson | 12.6% | 79 | 252 | 4.77 | 18 | 109 | 32.5 | 7.15 | 4.46 |
| 2020 | Dominick Wood-Anderson | 11.4% | 75 | 261 | 4.92 | NaN | 119 | 35.0 | NaN | NaN |
| 2020 | Hunter Bryant | 9.1% | 74 | 248 | 4.74 | 23 | 115 | 32.5 | 7.08 | 4.46 |
| 2020 | Brycen Hopkins | 6.2% | 75 | 245 | 4.66 | 21 | 116 | 33.5 | 7.25 | 4.28 |
| 2020 | Jared Pinkney | 4.9% | 76 | 257 | 4.96 | 23 | NaN | NaN | NaN | NaN |
| 2020 | Harrison Bryant | 2.9% | 76 | 243 | 4.73 | 13 | 110 | 32.5 | 7.41 | 4.37 |
| 2020 | Mitchell Wilcox | 2.2% | 75 | 247 | 4.88 | NaN | 112 | 31.0 | 7.37 | 4.43 |
You wouldn’t think a tight end with a 4.80 40-yard dash would top the list over one who posted a sub-4.5 time, but that’s what numbers say. Adam Trautman likely benefits significantly from his 6.78 three-cone time at 255 pounds, while Albert Okwuegbunam is probably hurt by skipping drills other than the 40-yard dash. Outside of those two, the model doesn’t see much chance of success for the rest of the class, at least only based on their Combine metrics.